Last week was horrendous to say the least. While the choppiness was expected as we discussed 2 weeks ago, but this chopfest makes you believe in the short term trend that emanates out of the volatility. One day you get bearish while another day it turns bullish. Given that we’re still in choppiest month of the market, I won’t be surprised if we see more of these chops. Let’s dig into the charts to know more:
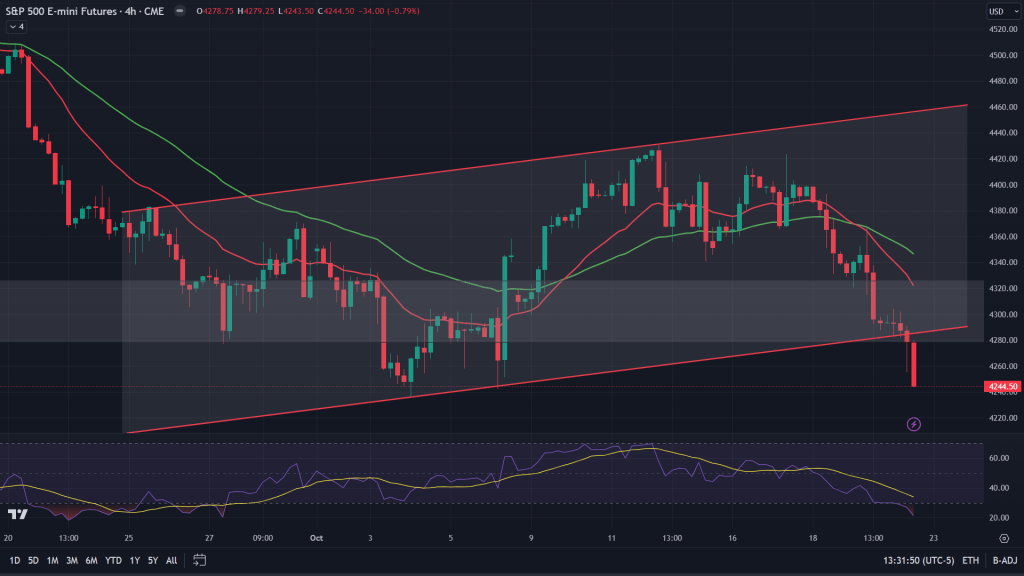
ES (4H): Ever since ES topped that channel resistance last week, it continued to dip further and over the course of previous the dip got deeper and the channel support too gave away on Friday after holding up for a bit. RSI has reached oversold zone and is a sign of caution for the bears.
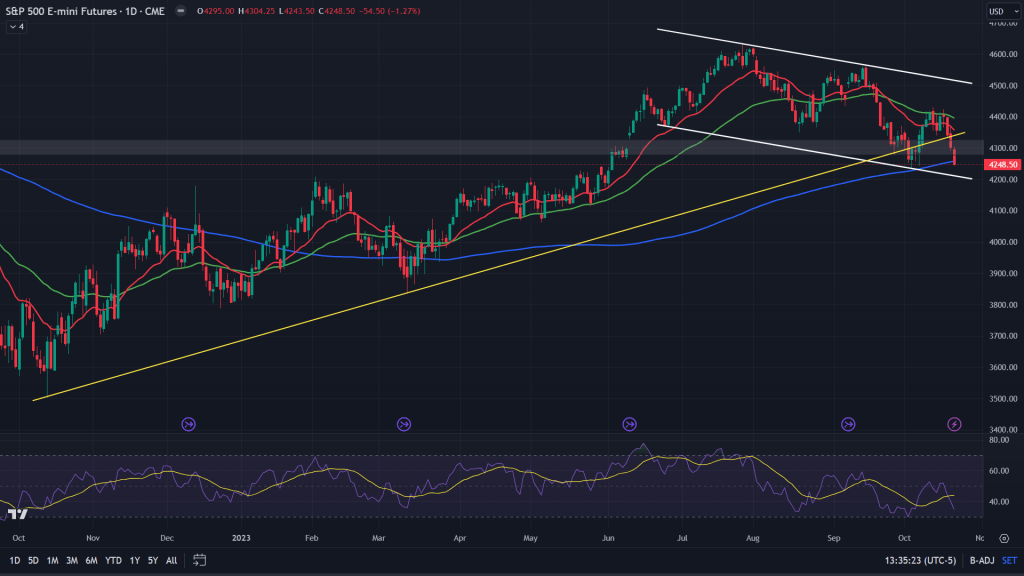
ES (Daily): Monday and Tuesday of the last week it was all about the 20 and 50 MAs of the daily chart and there were hopes for the bulls as even the key trendline (yellow) continued to hold the fort. But by mid-week all those hopes started dimming. First 20 and 50 MAs were rejected and then the trendline support too was lost. By the time the week closed even the mighty, dreaded 200 MA gave up. Whether double bottom around 4235 gives any meaningful bounce, remains to be seen.
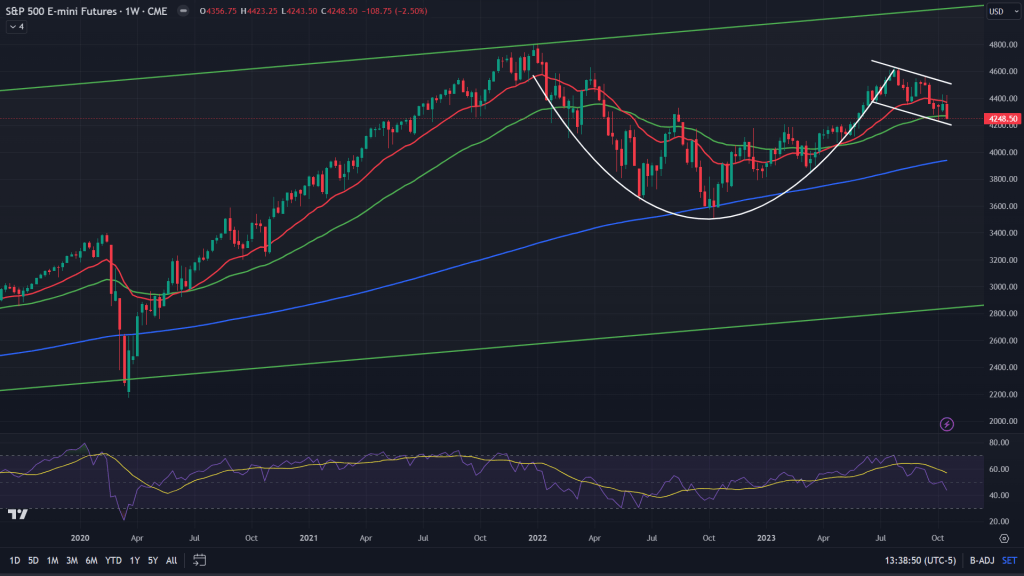
ES (Weekly): When we zoom out to the weekly chart, while the cup and handle pattern is still alive, all the hopes for a major bull run are starting to dim out. 50 MA of the weekly has given up and the channel support of the bull flag (handle of the cup) is right underneath and needs to hold.
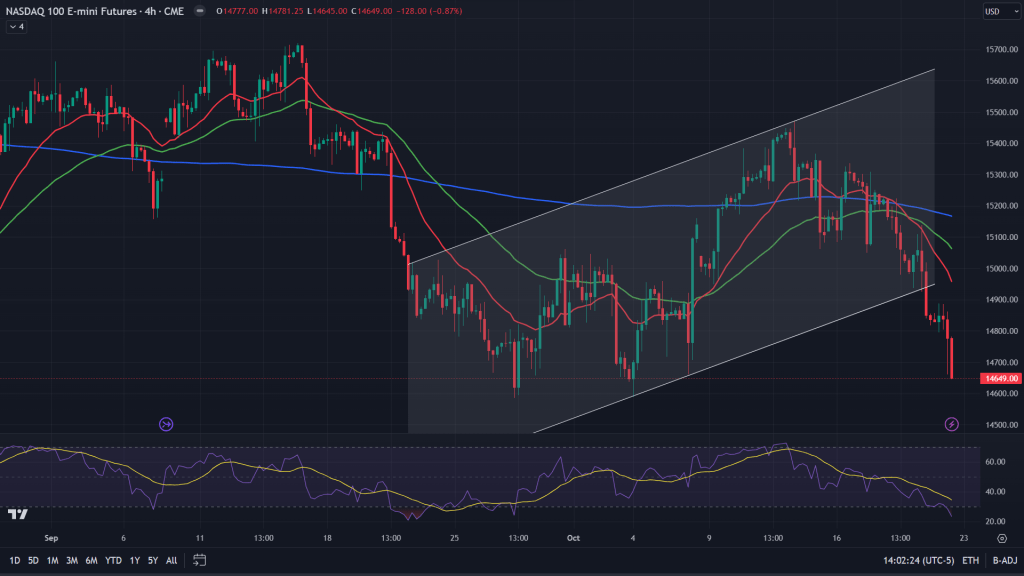
NQ (4H): Just like ES even the NQ did exactly the same thing – found resistance at the channel upper end, only to continue to get sold off. While the sell-off has been sharper, it has landed NQ at critical support on 4H and there can be some bounce/stabilisation effect in the next1-2 days. The consolidation/stabilisation is also crucial as RSI has reached oversold levels and it would only be prudent for the RSI to normalise.
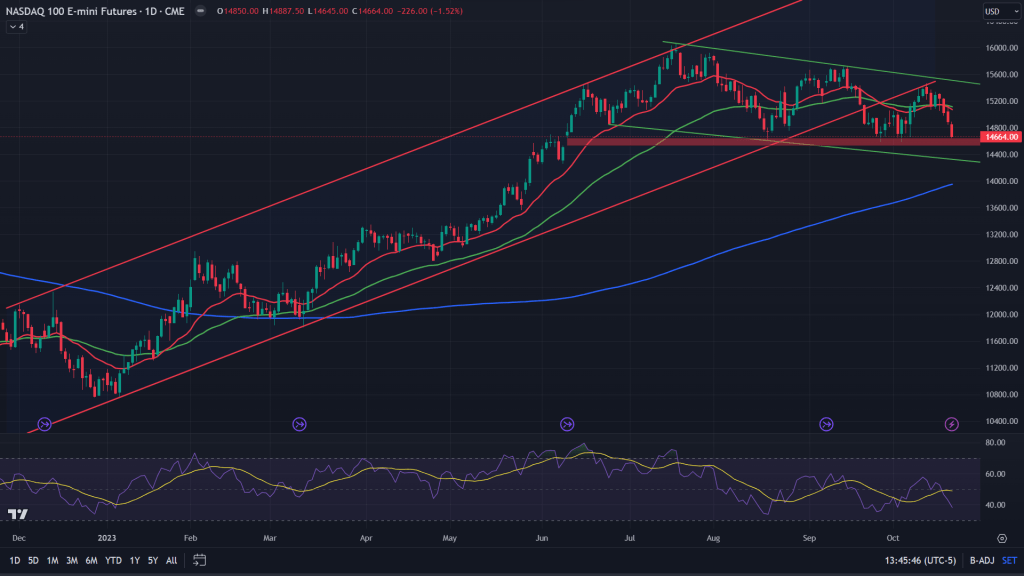
NQ (Daily): The only thing that separates NQ from ES is that the 200 MA on the NQ is still far deep down. That shows the strength tech stocks have been showing all through this year. Having said that, the gap left unfilled on June 9th gap up opening, is right underneath and probably its time to fill this up before showing any meaningful bounce.
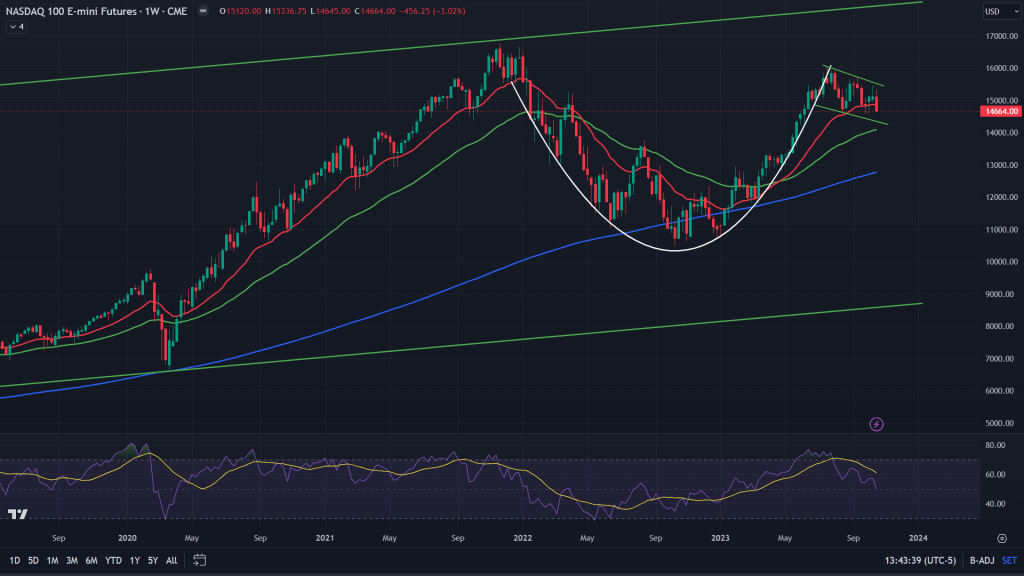
NQ (Weekly): The weekly chart continues to have similar story with that of the ES, with a key difference being, NQ still is far off its 50 MA on the weekly. But I believe 50 MA of the weekly would catch-up with here too, in the next few days/weeks.
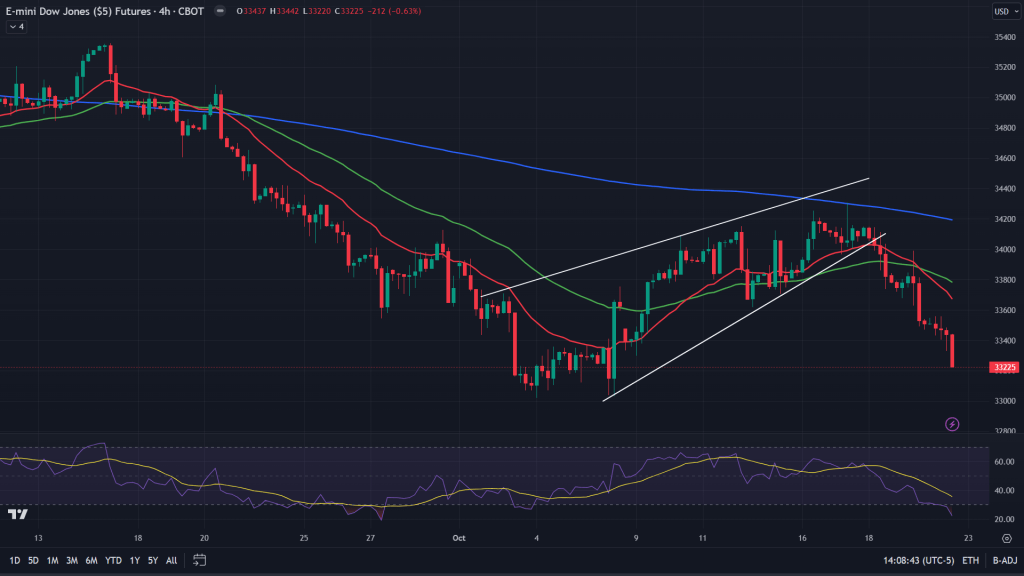
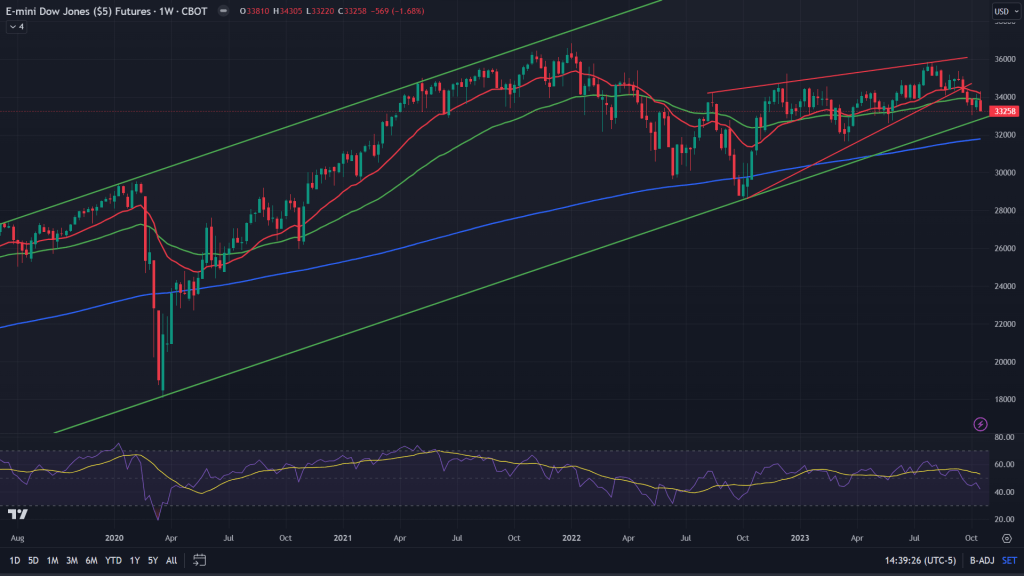
YM (4H): YM has been weak all through this year’s fall and still continues to be so. It broke down off that rising wedge on Wednesday ad now stands close to where it should in terms of attaining that target of the wedge breakdown. RSI reaching its oversold zone too.
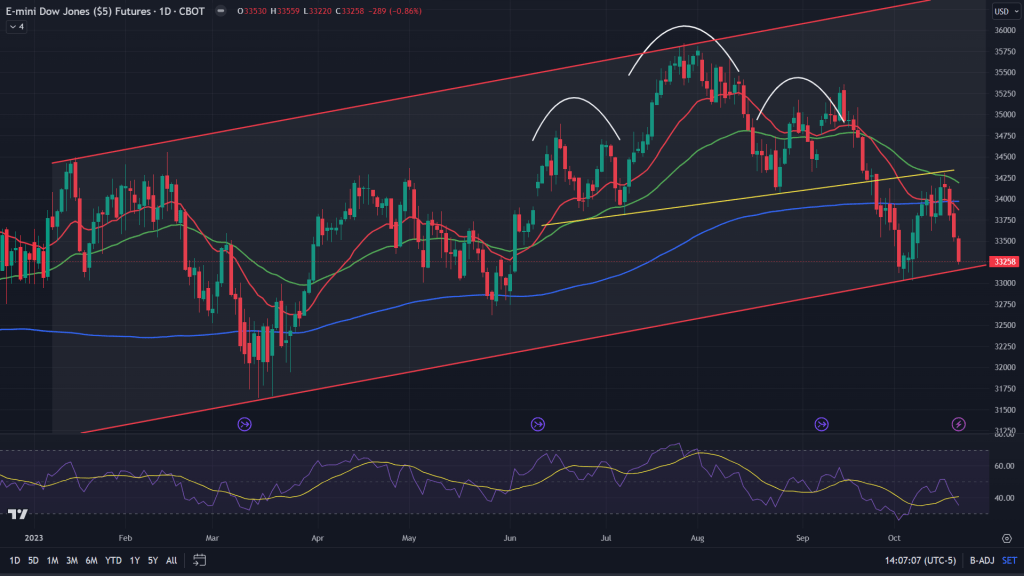
YM (Daily): That rally of previous week was nothing but all about backtesting the H&S breakdown, as we mentioned this in previous week’s post. Backtest rejection has caused YM to reach all the way down to key channel support. Bulls won’t be spared for long here.
YM (Weekly): While the daily is sitting right above the key channel support, so is the weekly chart of the YM. Yes, it is ok to hold your breath while market decides to crack past this key support or not.
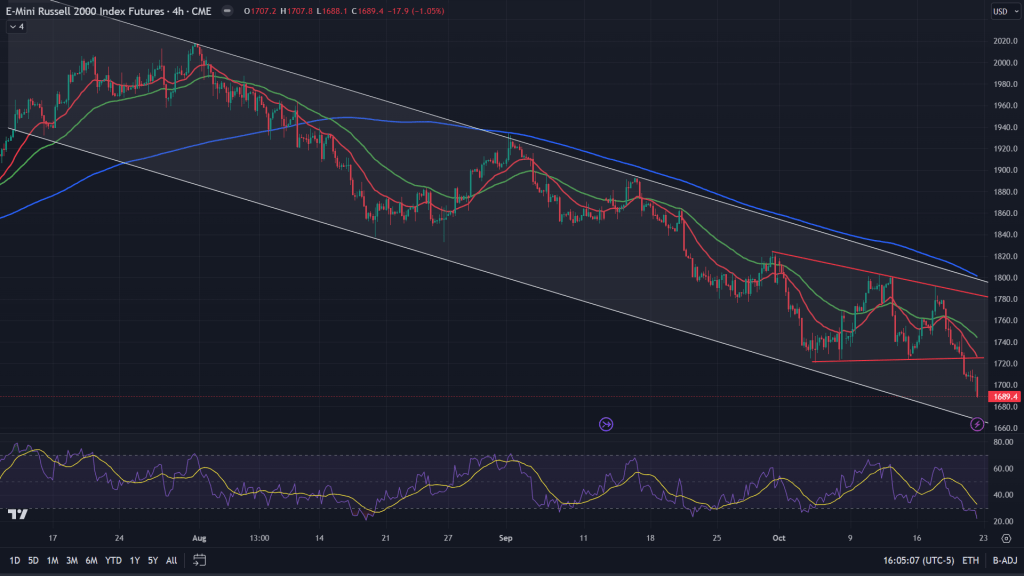
RTY (4H):
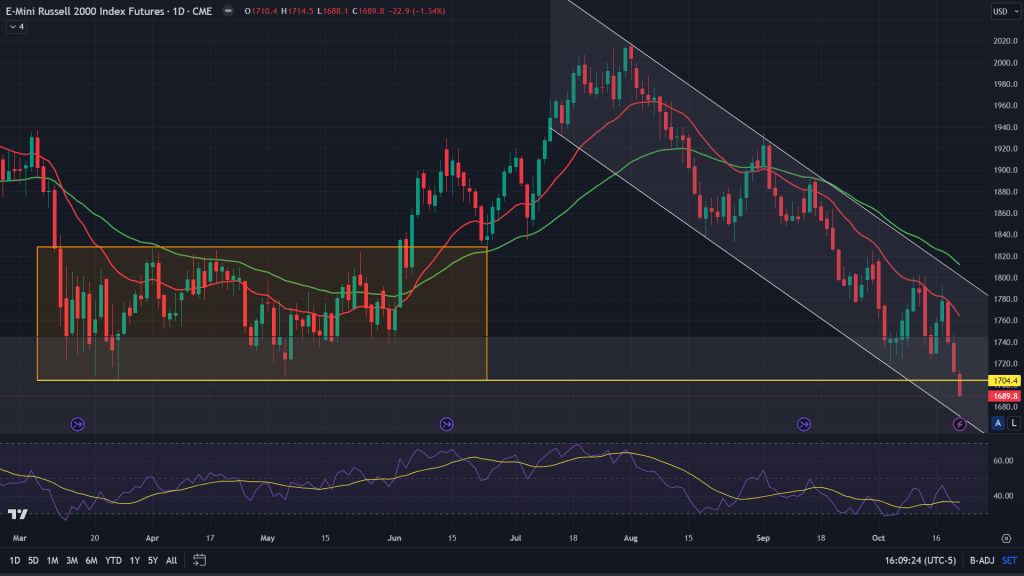
RTY (Daily): This sharp fall in small caps has been deadly. So deadly that it hasn’t given much respite for the bulls to bail themselves out. So sharp that it has broken one support after another and now has landed itself well inside the demand zone.
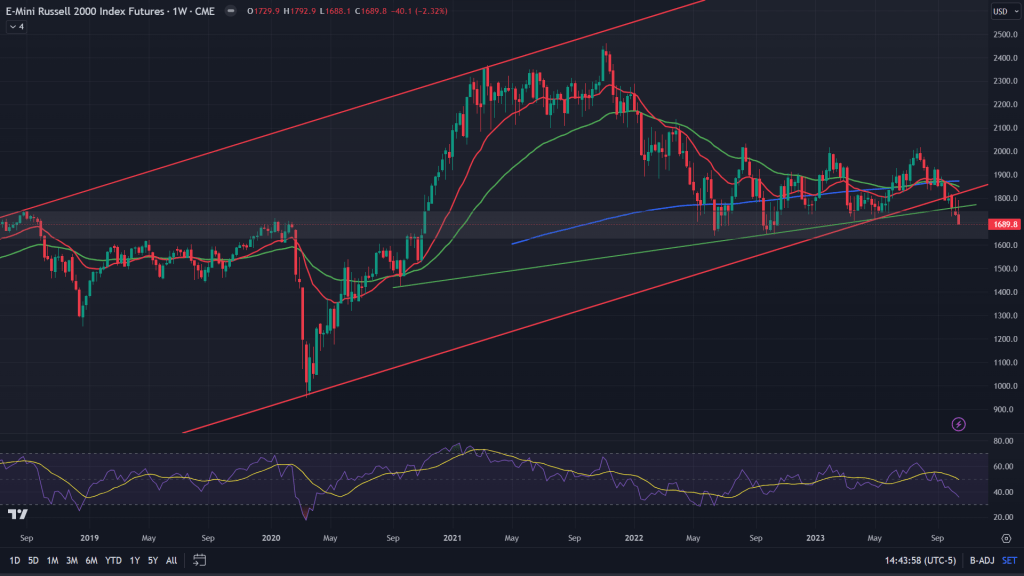
RTY (Weekly): This sharp fall in small caps got only severe because of key channel support, trendline and 200 weeks MA being broken down. The only hope for the bulls is that at some point inside this demand zone, RTY shows some bounce, which would also be helpful in a way because that would result in backtesting the breakdown of those key supports.
Conclusion: Given that markets have been falling relentlessly, many key supports and MAs have been broken. It’s only a matter of time when there would be some dead cat bounce. But as the name itself suggests, it would be a ‘dead cat’ bounce and don’t expect the bounce to be sharp enough to land us into the bullish territory anytime soon. Why? Because long term, weekly charts are not bullish. If at all, they are all on the verge of big bearish breakdowns.
Weekly video on the markets and certain stocks to watch: I’ve shared my views on $ROKU, $MS and $RELY apart from 10-year yield, crude oil and dollar index.

Leave a comment