What a reversal rally that was! While such rallies are common in a bear market, making one feel a sense of bullishness seeping in, it always makes sense to keep your eyes and ears open on any eventualities otherwise. Let’s take a close look and see what charts have on offer for us.
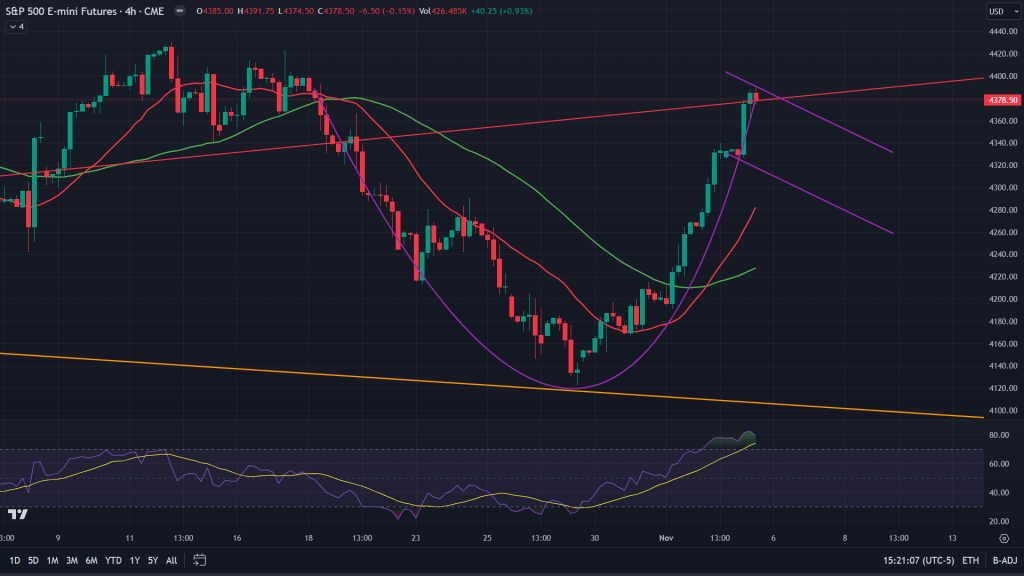
ES (S&P 500 futures 4H chart): When ES rallied from the bottom 4122, it was only an assumption that it’s perhaps bouncing off the channel support (orange line). But the more it rallied, the fader it became the possibility of going down any further and as of Friday’s close the rally was a U-shaped rally that has formed a cup like pattern and gives a hope for the bulls that it may form a cup and handle (handle yet to be formed). If it indeed does, then this rally wouldn’t end so soon after the completion (and breakout) of this cup and handle.
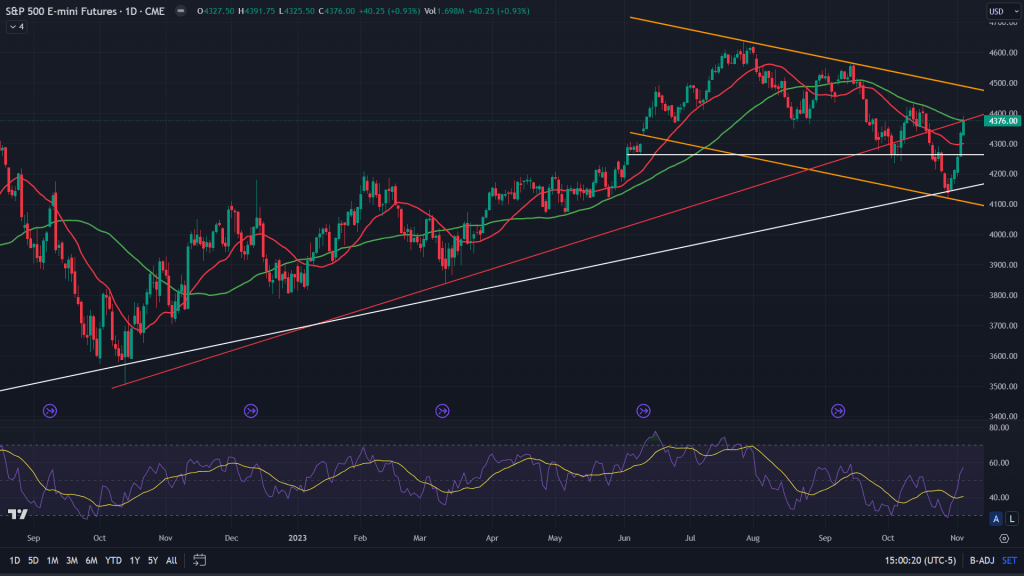
ES (Daily): When we zoom out a bit to the daily chart of the ES, the bounce was two faced – From the channel support along with key trendline support from the lows of 2020. Given how sharper the sell-off was, the rally too has been equally ferocious. It was so rapid that it didn’t even halt at 20 MA of the daily. Where did it stop though? At the 50 MA and the trendline resistance that it had broken down off just few days back. So the resistance at this juncture is critical and it won’t be a cakewalk to cross past. Also, for the market to rally all the way up to the channel resistance (yellow lines, upper end), it would have to form a high above the previous high, which was 4430.5.
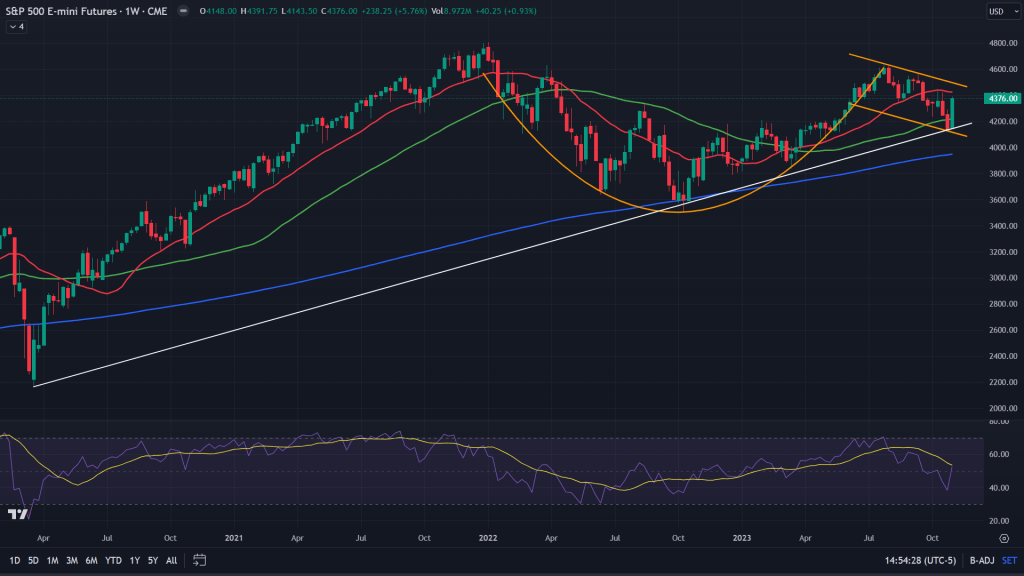
ES (Weekly): Is that much awaited and talked about cup and handle still in the making? It does look like, especially with that big a green candle of the last week. The rally cam exactly after breaking down off the 50 weeks MA and bouncing right after in the week followed. That speaks the volume of this rally. If (big if that is) this rally has more legs and steam left, then next week it wouldn’t give up all. But for any reason, it does, then don’t expect those trendline supports and 50 weeks MA to hold. It would just break.
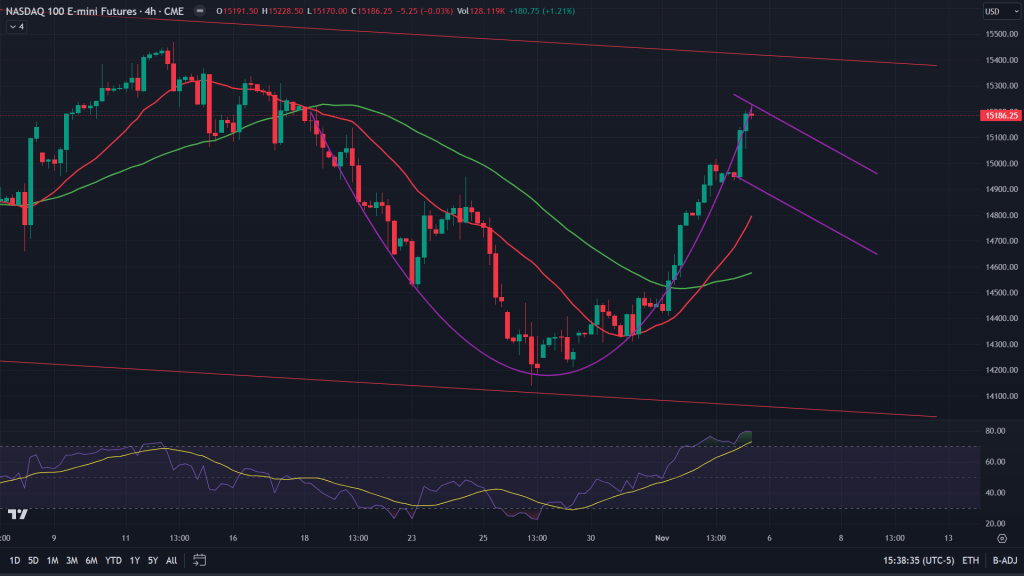
NQ (Nasdaq 100 4H chart): Nothing new to write when it comes to NQ, pretty similar to ES in every single way, including the formation of cup and handle on the 4H chart.
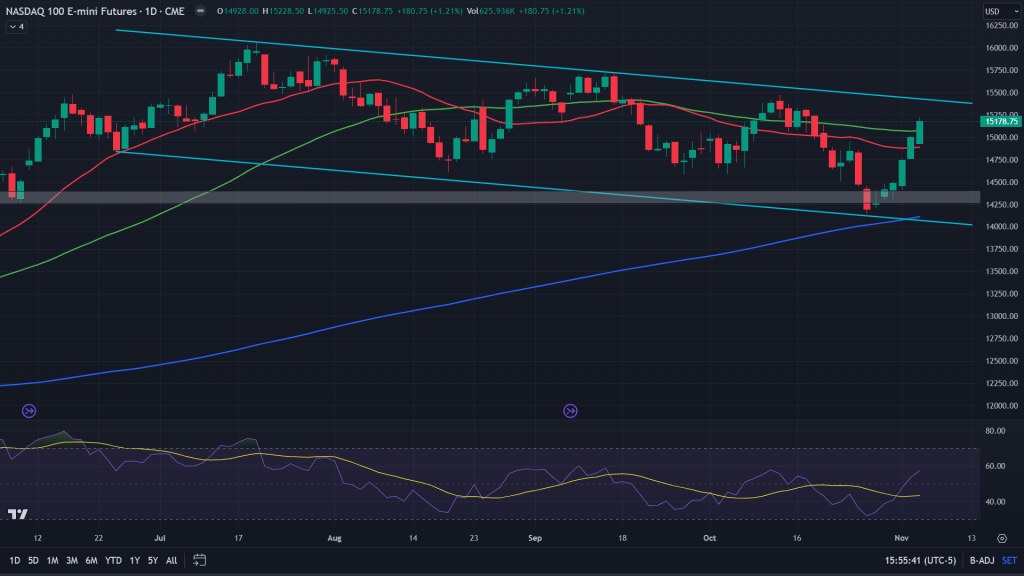
NQ (Daily): The daily chart explains it far more clearly. The bounce that came, was not only off the channel support, but also off the demand zone on the daily and just shy of 200 MA. Where did it stop? Just above the 50 MA of the daily. If it can sustain this 20-50 MA convergence and continue to rally past the previous pivot high (15468.75), which cold possibly also be the upper end of the channel, we would have bigger rallies in the offing.
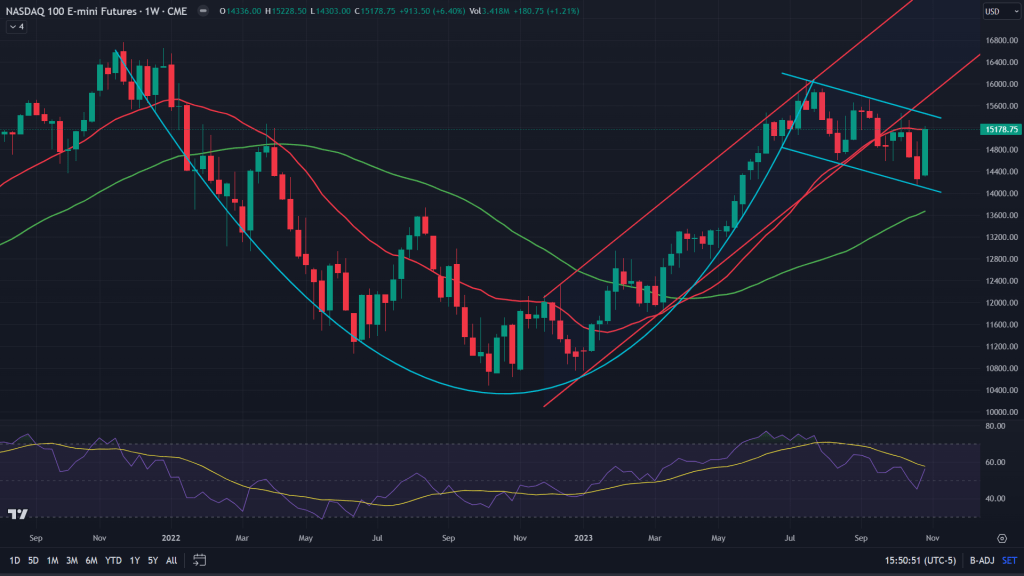
NQ (Weekly): Weekly chart of the tech index has much more insights to offer. While that big a green candle is welcome, it continues to give us hopes of the big cup and handle breakout we all have been talking about for a few weeks now. We are right at the 20 MA of the weekly chart. Unless something untoward happens and all these gains are evaporated in a jiffy, there is every likelihood of the next few days/weeks being extremely bullish.
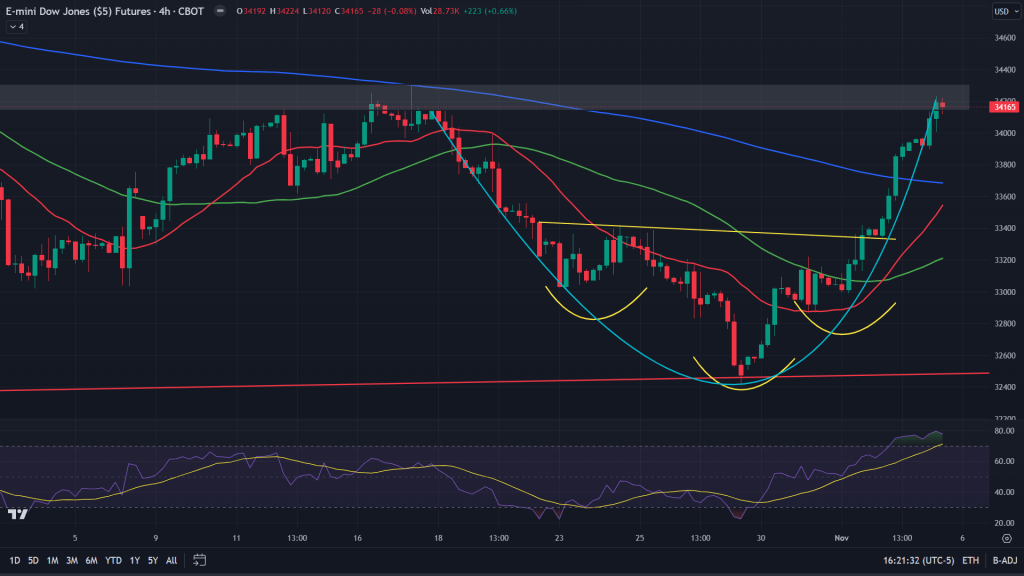
YM (Dow Jones Industrial Average Index 4H chart): Middle of the week (Wednesday), I had posted this on Twitter (or X), that we’re forming inverse H&S on 4H chart on Dow Jones and we should rally further from here (here’s the tweet), that indeed broke out and we continued to rally. But let me be very honest, I did not expect such stupendous rally even after the breakout. The assumption was it should/would stall around 200 MA of the 4H chart and then backtest and then rally again. But there was no backtest. It just continued to rally and in the process Dow too has formed cup like formation on 4H chart, just as ES and NQ have. It has closed Friday at supply zone and I would expect the supply zone to be respected and probably formation of the handle from here. Either in the form of a flag or a base like formation.
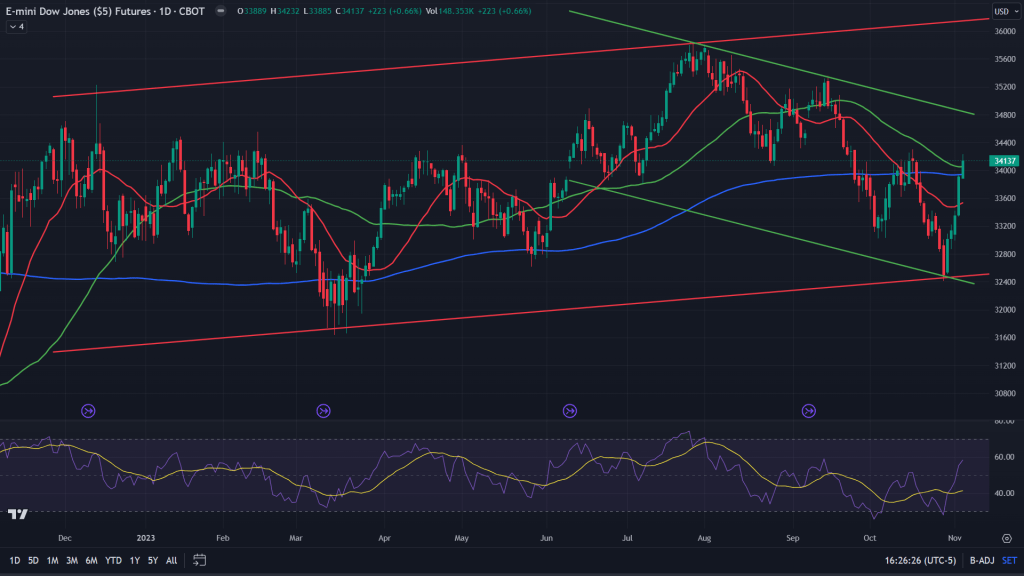
YM (Daily): This vertical a rally, just like ES and NQ, usually occurs at a critical support, which is what it did and very sharply. Taking two supports off channels and rallied all the way upto 200 and 50 MAs of the daily chart. Key would be to cross past the previous pivot high (34305) for the rally to continue towards a bigger breakout.
YM (Weekly): On the weekly chart, while in the previous week, it looked like a big breakdown, that failed. That’s a very big thing and has a lot to offer for us if we have to see what is about to come. Just like in the recent past those breakouts had failed, this time a big breakdown has failed and I would assume it should do exactly reverse of what it it after a failed breakout – Rally further from here. Key to note though, it shouldn’t reverse and equally ferocious way from here and any pullback should be shallow for the rally to continue.
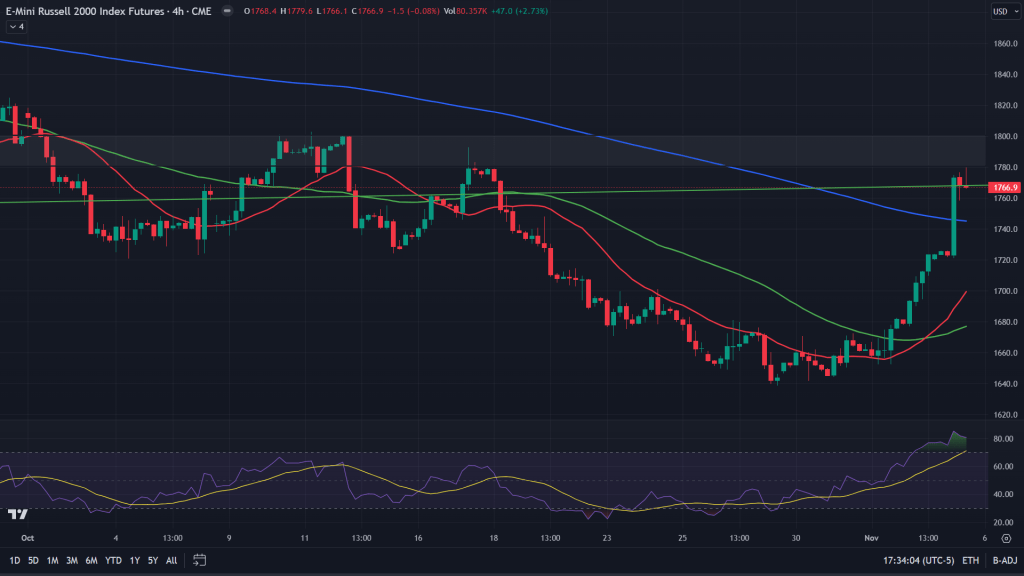
RTY (Russell 2000 Index futures 4H chart): On Tuesday, I had tweeted that the shorts are in danger at this point (read the tweet here), what followed after that is there for everyone to see. Yes, I did expect the rally to continue even after the bottom was formed, all the way upto 1710 and 1740. But it surprised me by rallying even further way to reach almost on the breakout of the channel it has been into during this entire fall. It has now stopped exactly at the 4H supply zone, along with extremely overbought RSI. I would expect some consolidation before it decides to attempt on a breakout.
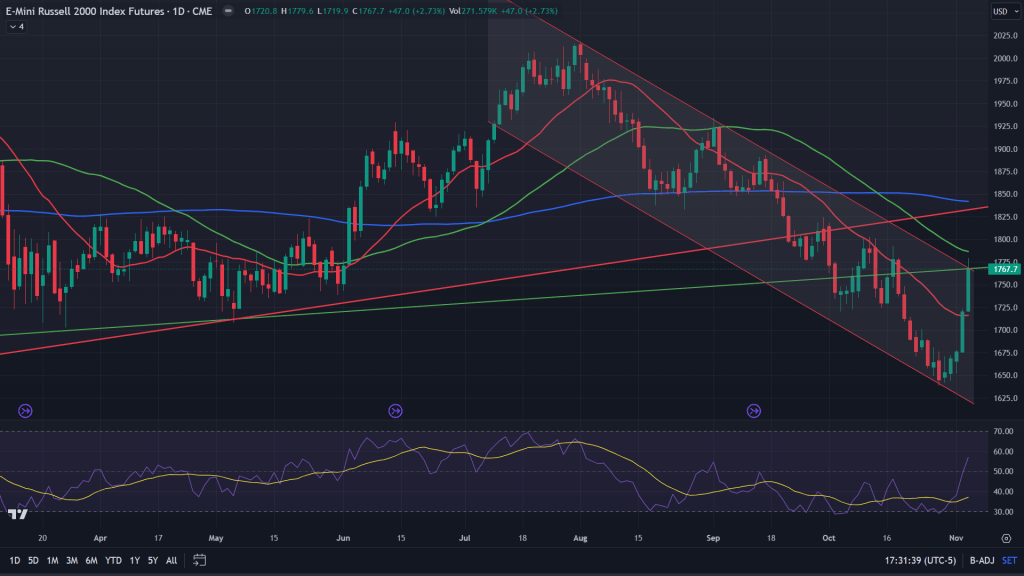
RTY (Daily): Zoom out further in and the rally has crossed past the 20 MA of the daily after rallying exactly at the bottom of the channel. Stopping right under the big trendline where it had broken down of. Now, whether it is a backtest of this breakdown or it has further to rally from here, is something we have to see. For now, I would expect consolidation from here for a few days.
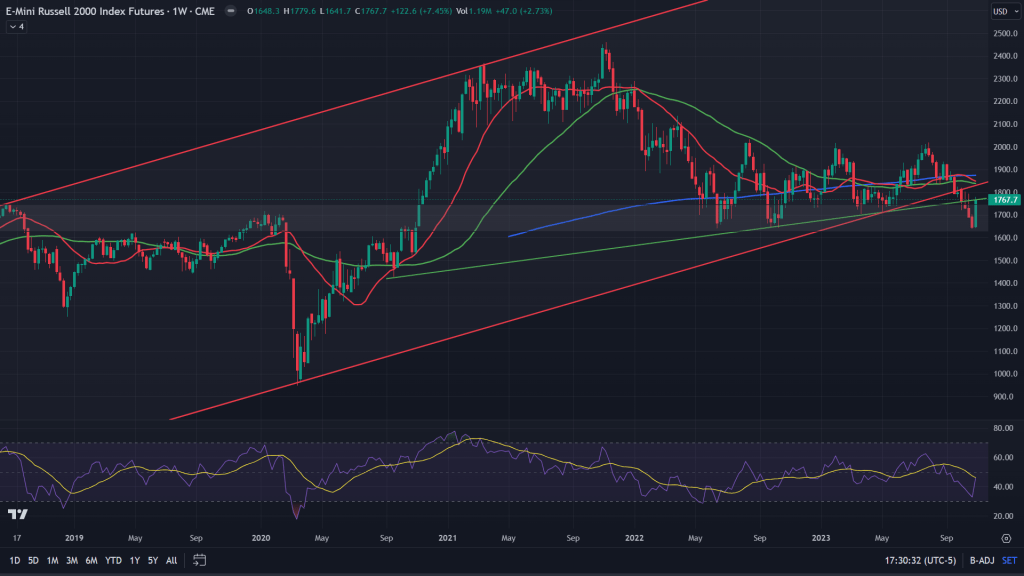
RTY (Weekly): Weekly chart of the RTY has far more insights to offer. Quite a few things to note here. 1) The rally has come off the bottom of the demand zone. 2) Leading us exactly at the trendline resistance it broke down of (green trendline). 3) There is still a likelihood of backtesting the channel breakdown (red lines), along with 20, 50 and 200 weeks MAs. Surely, we have rallied big last week. But bulls are not out of the water yet. Certainly not on the RTY.
Conclusion: For the coming week, especially the first half of the next week, consolidation and basing is the name of the game. IF that cup and handle on the 4H has to complete itself, it must do so within the next 2-3 days and then lead us towards a breakout and upwards. This is all the more crucial and applicable for the major 3 indexes. But the confidence shakes once you look at RTY. That’s where major danger is lurking and I would watch that space far more closely than the other indexes. 1900 on the RTY would be my line in the sand before bears throw in the towel.
Weekly markets video update with Mukund:

Leave a comment