Welcome back everyone! I was away last week due to Diwali celebrations and couldn’t really put in enough time and efforts to put together my thoughts. But now that I’m back at the desk, let’s take a quick look at what the price action suggests!
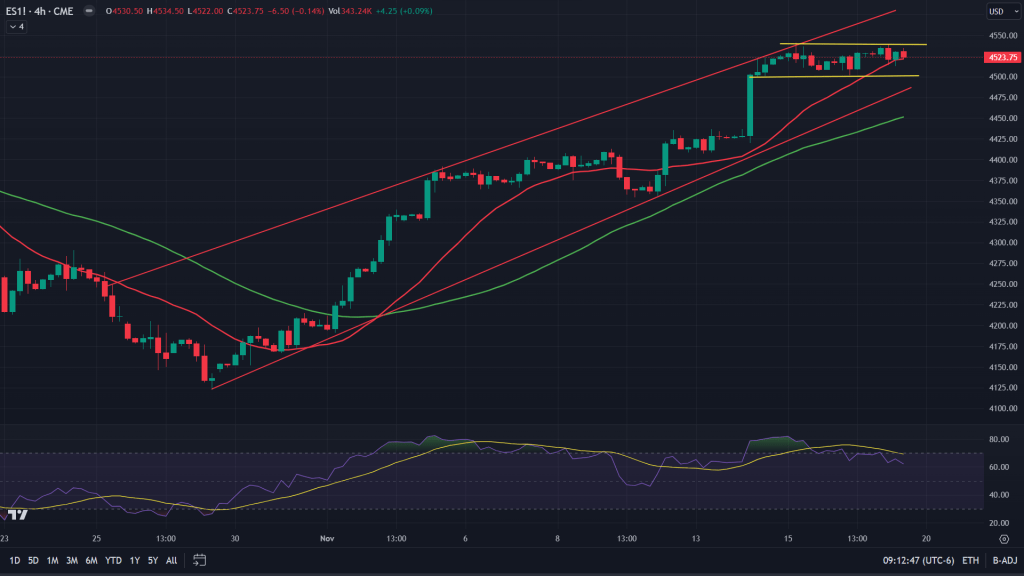
ES (4H): Ever since ES started this rally, it has been a vertical rally and been forming a rising wedge. Noteworthy here, it has been making a higher base (yellow lines) for major part of the previous week. Although high bases are usually bullish frameworks, I would be a little cautious here given the formation of rising wedge (red lines) and negatively diverged RSI. As I have mentioned earlier, the first sign of a formation heading towards a breakdown is when it stops touching the upper end of the wedge/channel, while still making a high – This condition is already in place.
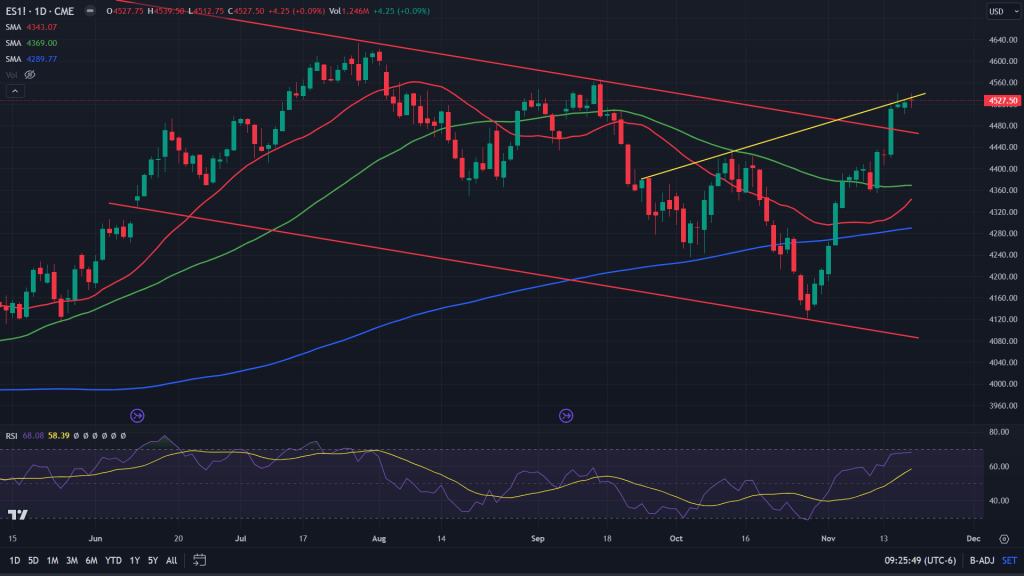
ES (Daily): When we zoom out, ES has clearly broken out of that channel (red), although struggling just around the trendline resistance (yellow). If it fails to sustain/cross past this trendline, there is a likelihood of this channel breakdown failing. Especially when the momentum and strength of the bull run has been fading off.
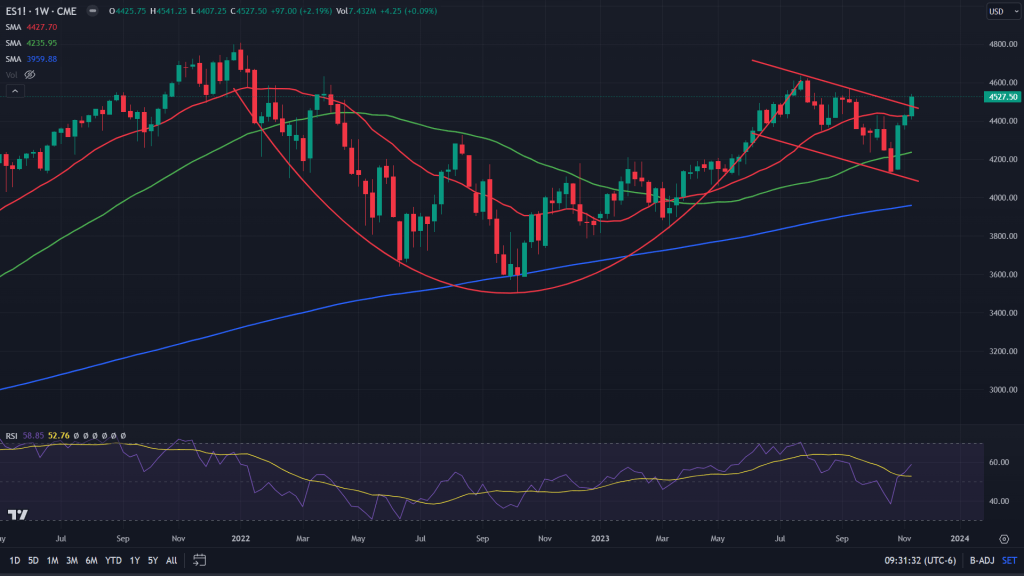
ES (Weekly): Zoom out further and we see the significance of the channel breakout. It’s actually a cup and handle breakout. But as mentioned earlier, it needs follow through. Most of the breakouts (and breakdowns) need to prove their worth by way of a backtest. We would know in the coming days/weeks if this breakout has any meat.
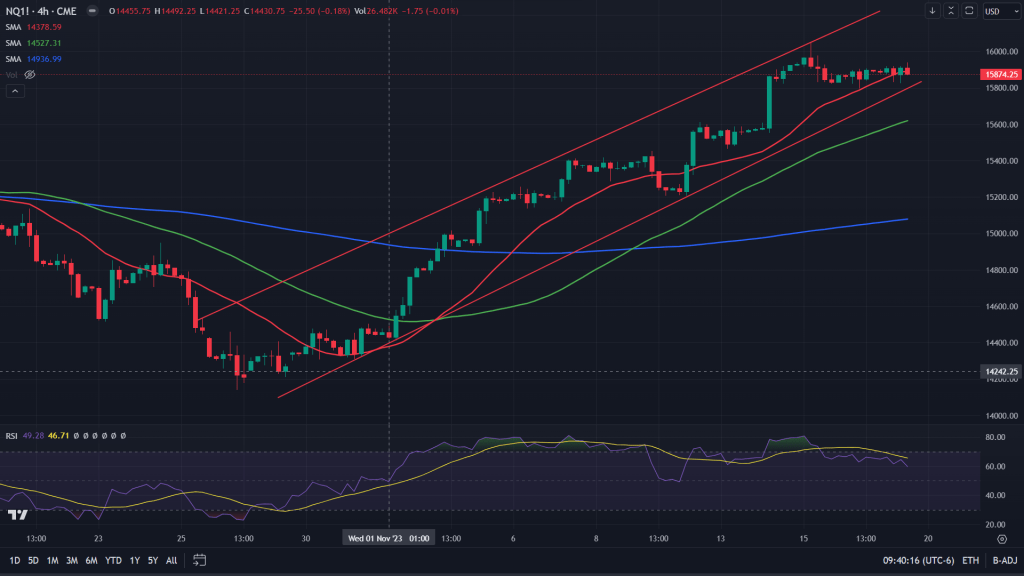
NQ (4H): Similar to ES, even NQ has been rising in a wedge formation in this vertical rally, along with basing out after hitting that upper end of the wedge. RSI negatively diverged. Time for a caution.
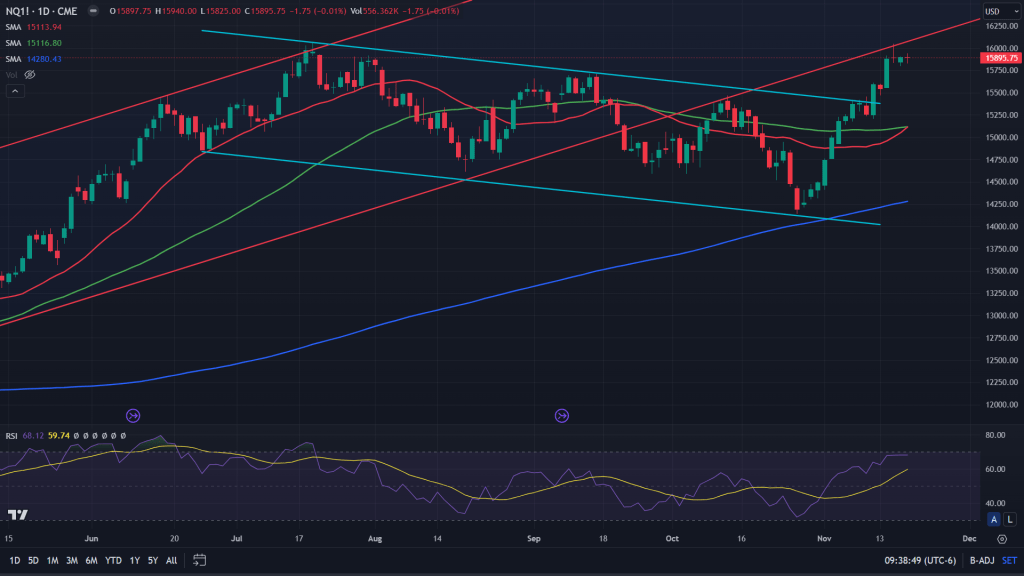
NQ (Daily): Zoom out and we see where the price has been stuck at – Backtest trendline (channel) of the big breakdown that we witnessed last month. Also, since NQ broke out of that blue channel, it hasn’t backtested the breakout. May be its time for a backtest?
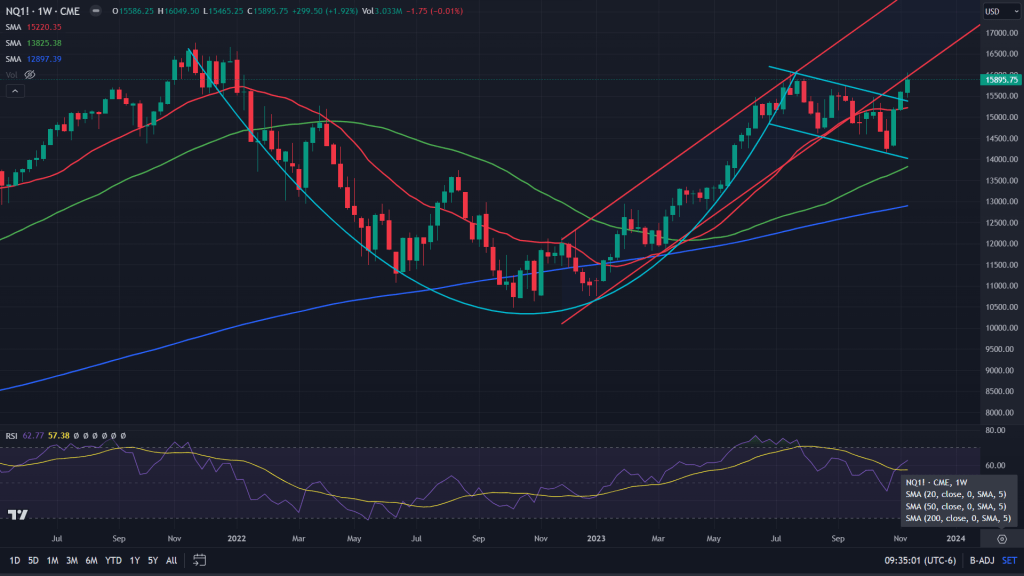
NQ (Weekly): Zoom out and we see what this channel is – Similar to ES, it is the Cup and Handle breakout and has enough meat to carry it further, if it can sustain the backtest.
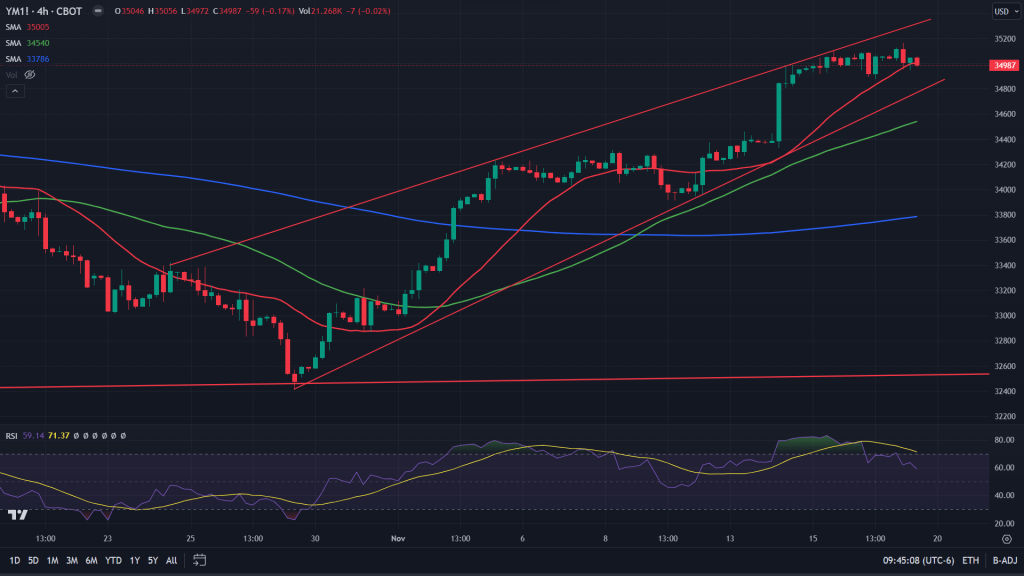
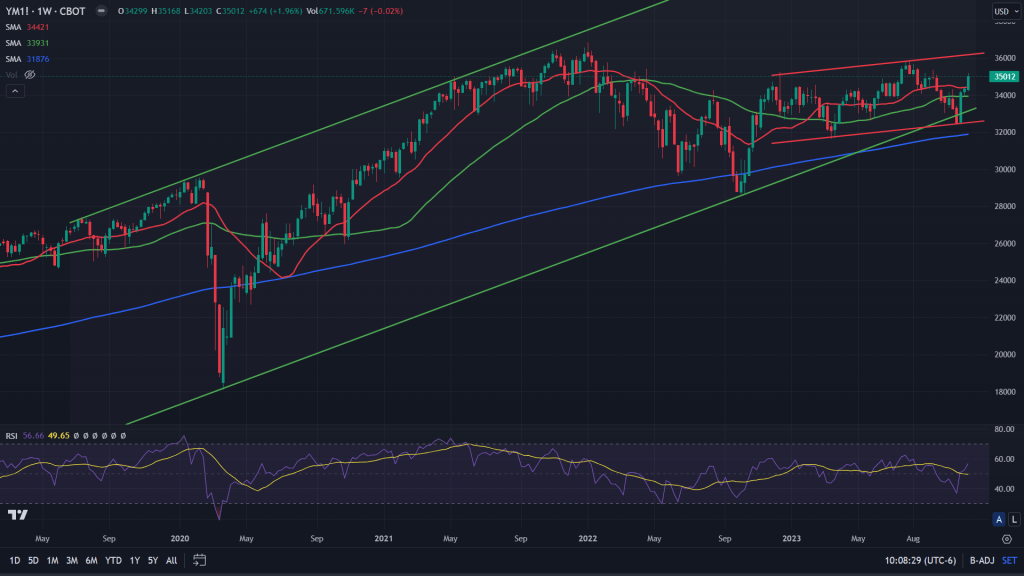
YM (4H): No different for YM too. Rising wedge on the 4H and seems to be topping out, along with overbought and negatively diverged RSI.
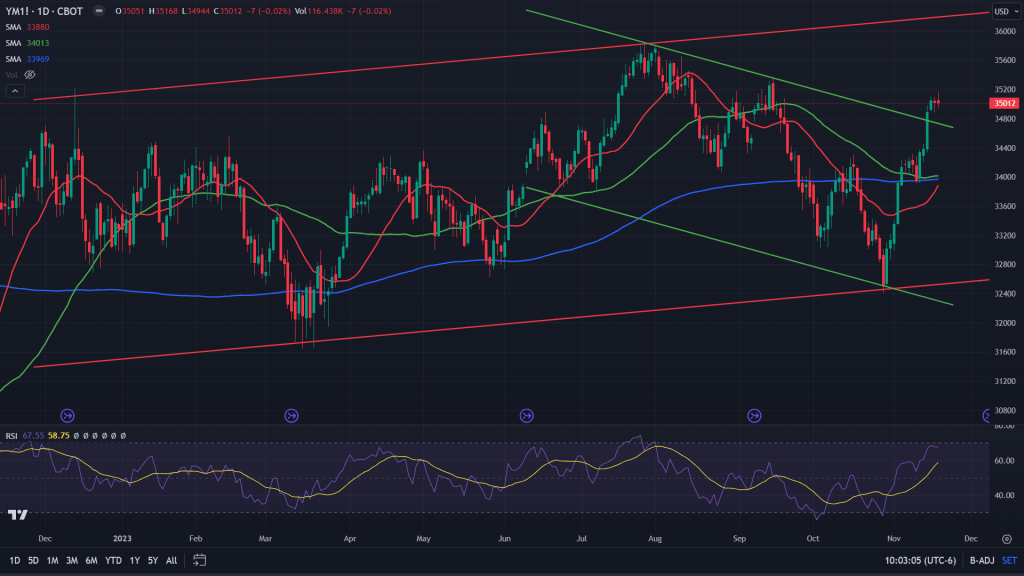
YM (Daily): Daily chart of the Industrial index has broken out of that channel and has been showing signs of loss of momentum. Remains to be seen if the backtest fails or results into resumption of the rally.
YM (Weekly): While daily chart has broken out of that channel, weekly is still inside another channel (red), while managing to escape the breakdown (green). Some more time before it decides if it wants to rally further ahead and break out of that red channel too or fizzle out.
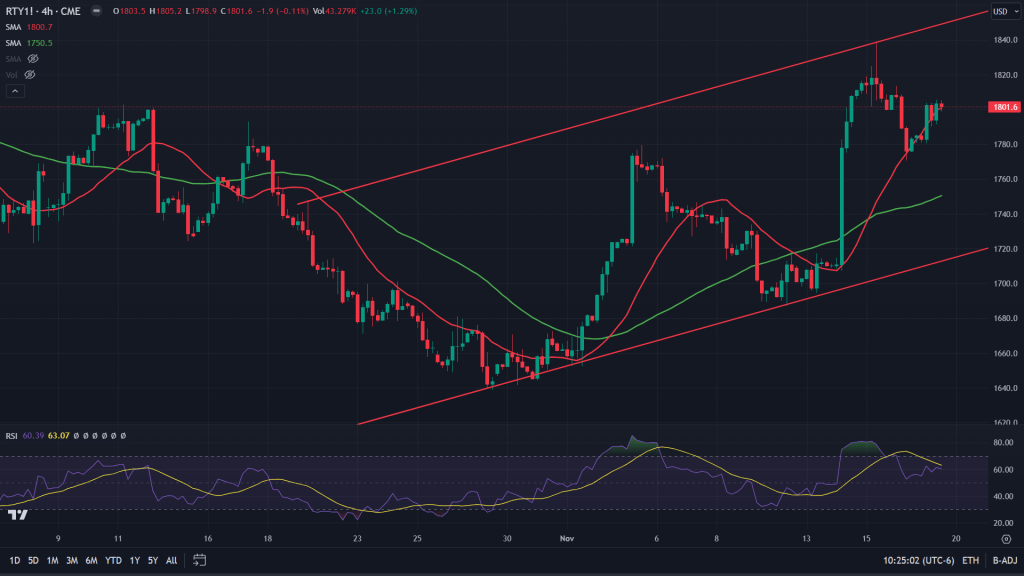
RTY (4H): Inside that big red channel, not a clear picture if it wants to rally further or fall off, except one thing – negatively diverged RSI.
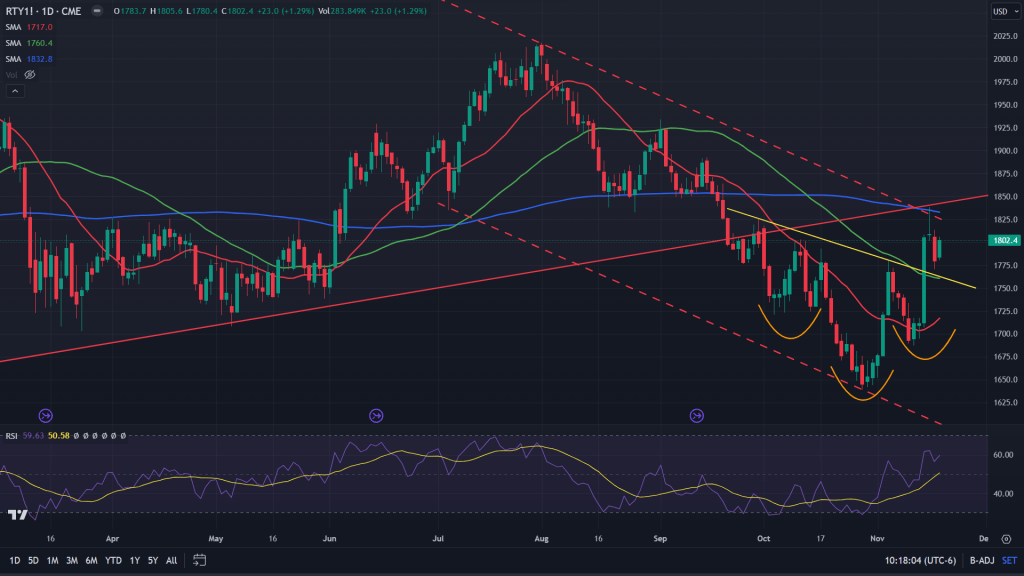
RTY (Daily): On the daily, after breaking out of that inverse H&S, RTY has also backtested it, along with respecting the 200 MA and the trendline resistance (red). Wait and watch here too.
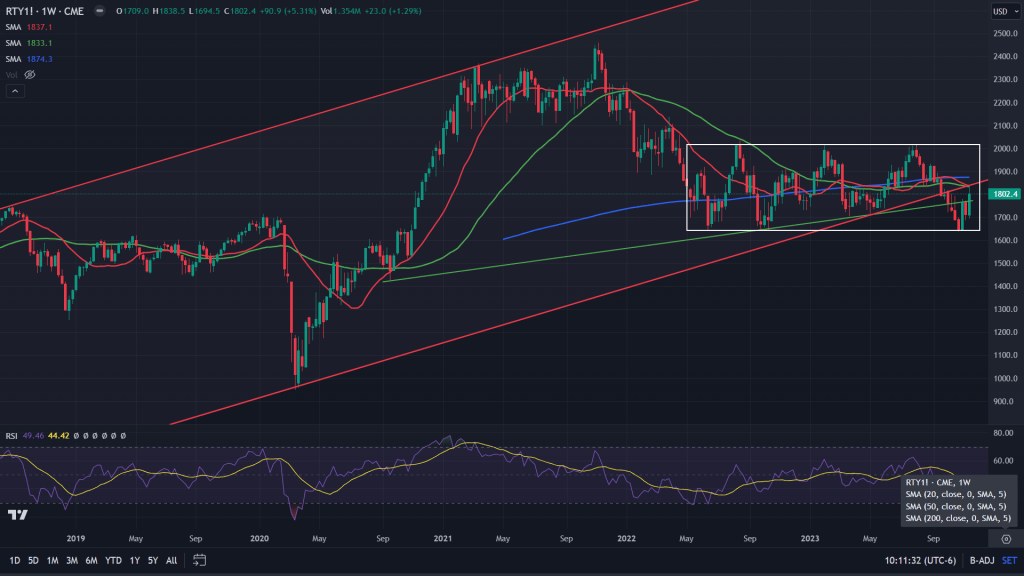
RTY (Weekly): Zooming out further, big backtest of the channel breakdown is done. Next week would be crucial if bears can capitalise on the backtest reversal.
Conclusion: While ES and NQ do have some clear signs of topping out on the 4H chart, weekly charts for both of them have momentum going for them. All that the bulls need is capitalising the backtest. In case of RTY its the other way round – 4H chart is not much clear except that the RSI is negatively diverged, while the weekly has backtested a bigger breakdown. I would trade this week very cautiously on either side. If bearish I would book out quick and if bullish I would have my stops very tight.

Leave a comment