Happy (belated) thanksgiving everyone! There is a reason the headline of last week and this article is the way it is. Thanksgiving is the time when market participants start taking time off to be with their family and are not really bothered to look at the gyrations of markets. When there are less participants, volumes certainly diminish and markets go nowhere. Yet, here we are, trying to decipher what and where the price action is headed. Trying to see if anything we missed, if anything new we get and if anything that market is trying to show us under the hood. Lets take a deep dive.
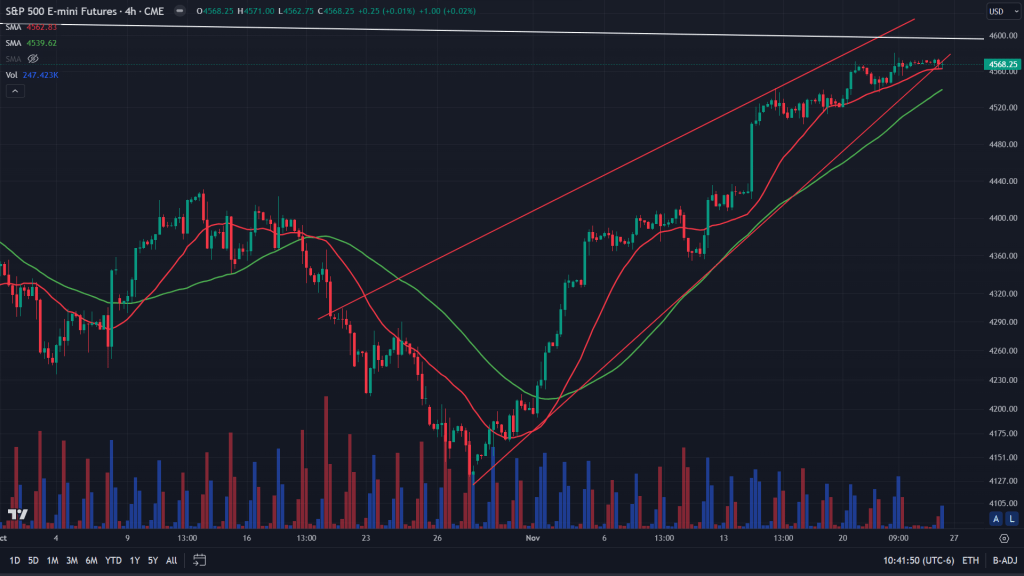
ES – S&P 500 futures (4H): This sharper bounce is still continuing to rise inside the wedge. While RSI and MACD have certainly diverged negatively, price still continues to climb up in a slow and gradual manner. There is some resistance too on the upside which is probably the reason why we haven’t seen prices moving up much. Adding pressure to the no movement is lower volumes.
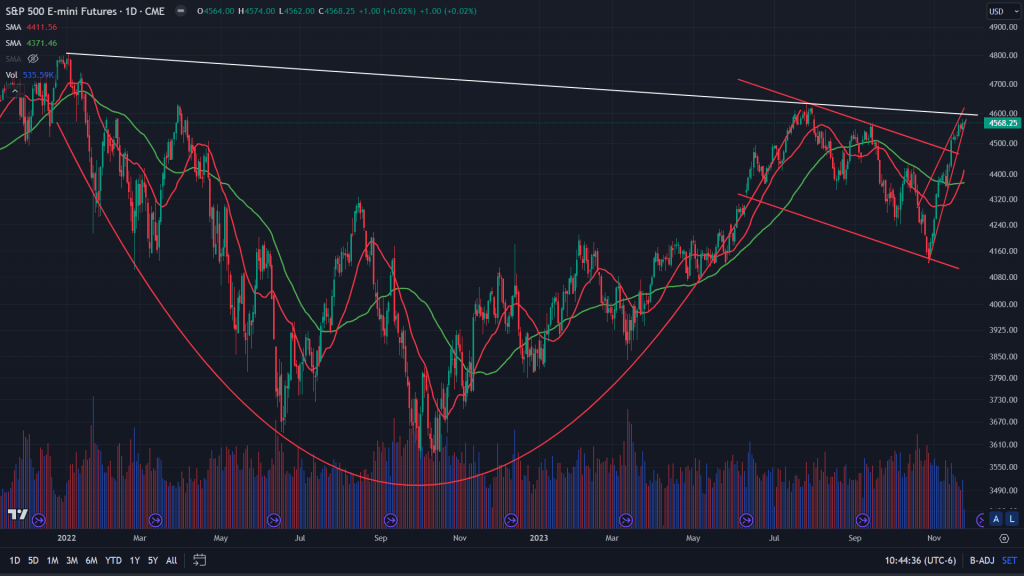
ES (Daily): Zoom out a bit and we see the structure more clearer. While the Cup and Handle has broken out, there is a trendline resistance (white line) overhead that should result in backtest of this breakout – a key of this breakout to prove its long term viability.
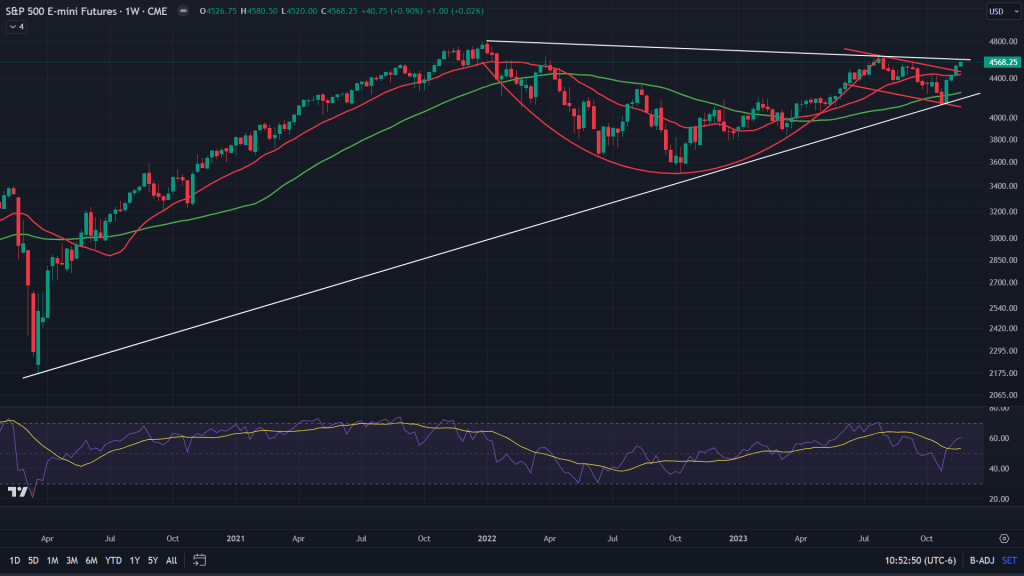
ES (Weekly): Zoom further out and the pattern is visible far more clearer. Its a long term triangle and cup and handle pattern. While the C&S has already broken out, we are sitting right under the breakout point of the triangle. Expect prices to respect the upper end of the triangle by come off a bit before attempting to break out.
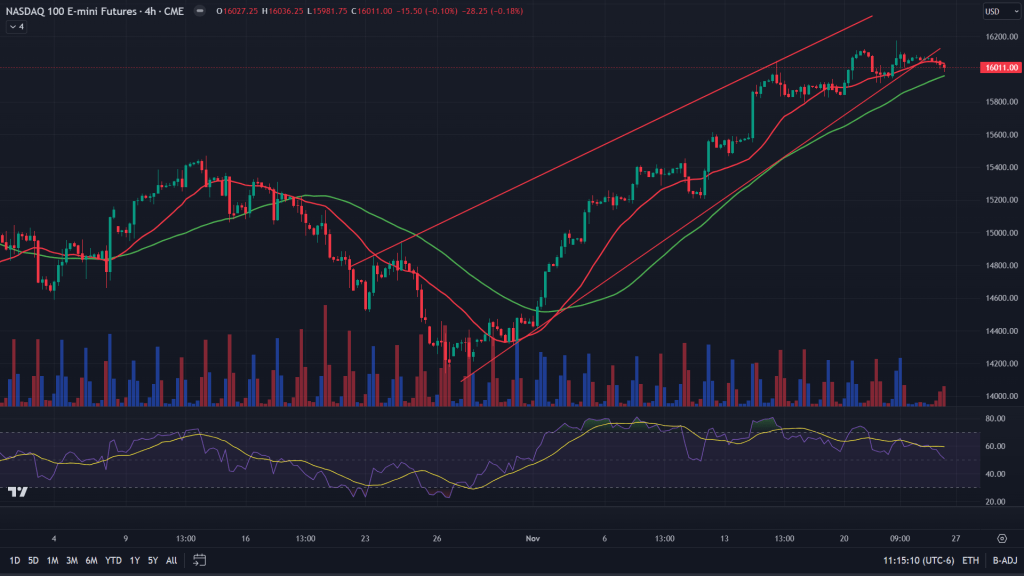
NQ – Nasdaq 100 (4H): It seems to have broken down off lower volumes and it doesn’t seem bearish yet. For a breakdown to sustain, it needs follow up price action, which is missing.
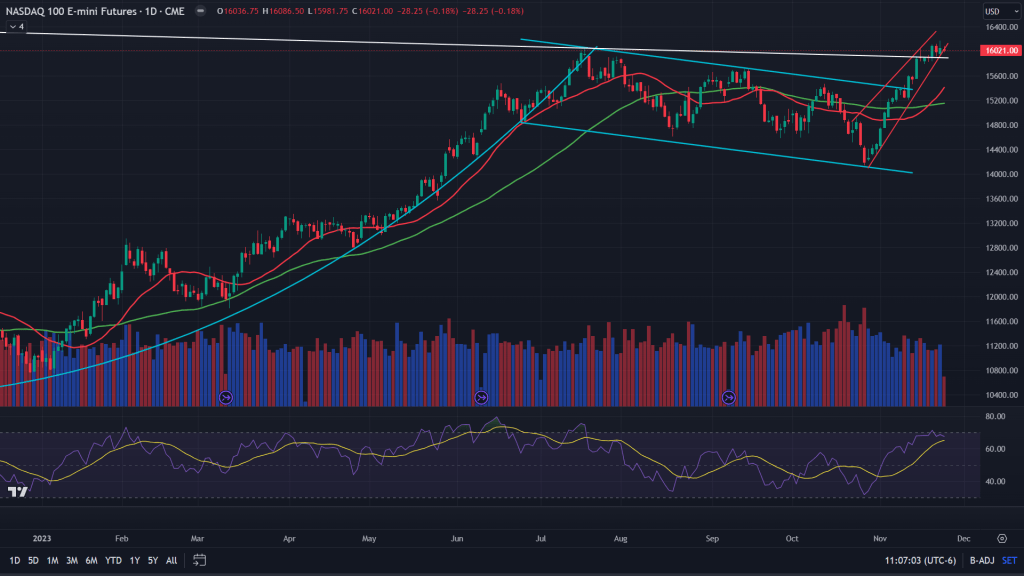
NQ (Daily): When we move from 4H charts to the daily chart, we see that NQ while broke down off the rising wedge, it is still above a key trendline resistance (white line).
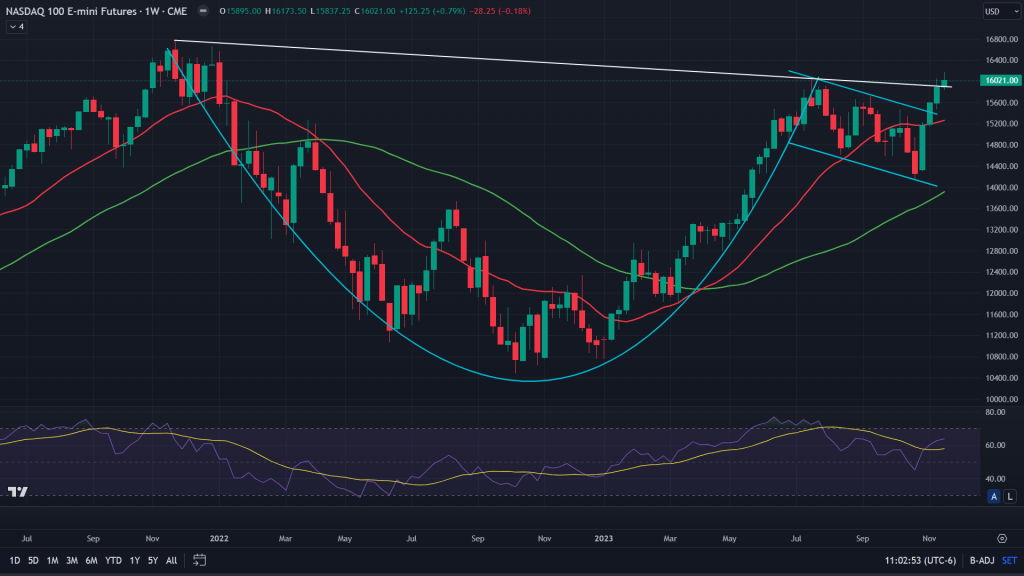
NQ (Weekly): Weekly chart of NQ gives far more clearer picture. So far it looks like a dual breakout. Although it’s been a four consecutive weeks of green candles and we should expect some give back, I wouldn’t be surprised if we eventually tend higher, especially when we’re headed into low volume year-end trade.
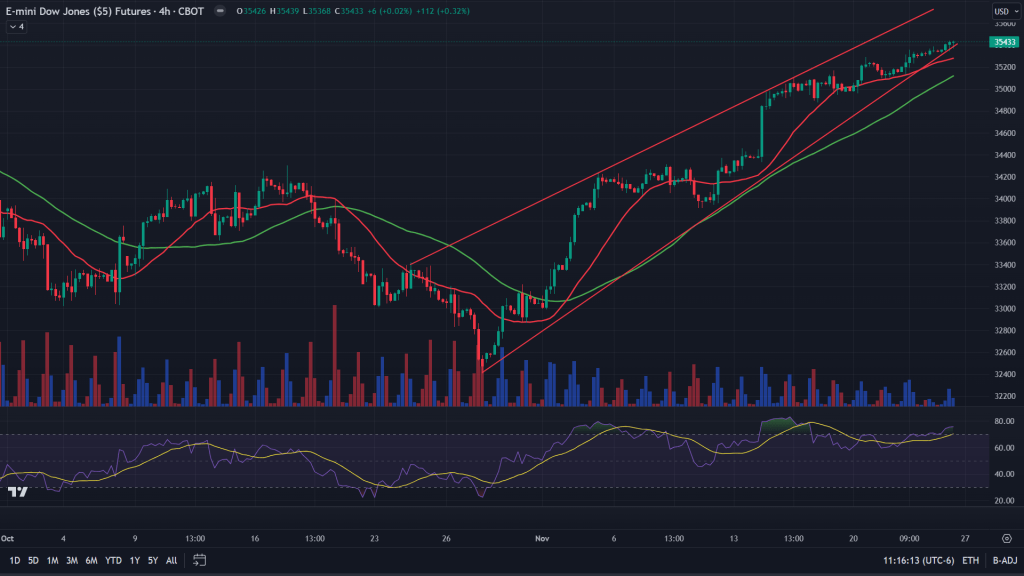
YM – Dow Jones Industrial Average (4H): YM is on the verge of breaking down of this rising wedge and probably next week we should be able to see some action on the lower side.
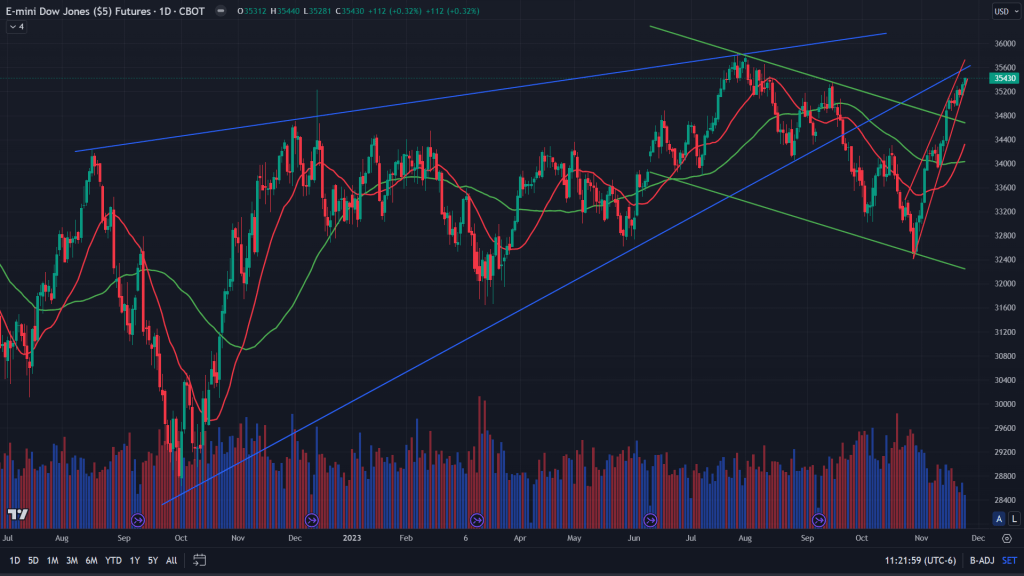
YM (Daily): Daily chart of YM is quite something to look into. Bear with me. 1) It is backtesting the falling wedge breakdown that occurred in September. 2) It has broken out of the channel that has been holding it up ever since it peaked in July. 3) The steepness of the rise that deserves a break. Given the scenario, as and when prices correct from here, it would do all the 3 things together – 1) Respect the backtest of breakdown. 2) It would also backtest the breakout (green channel) and 3) It would fall off the rising wedge.
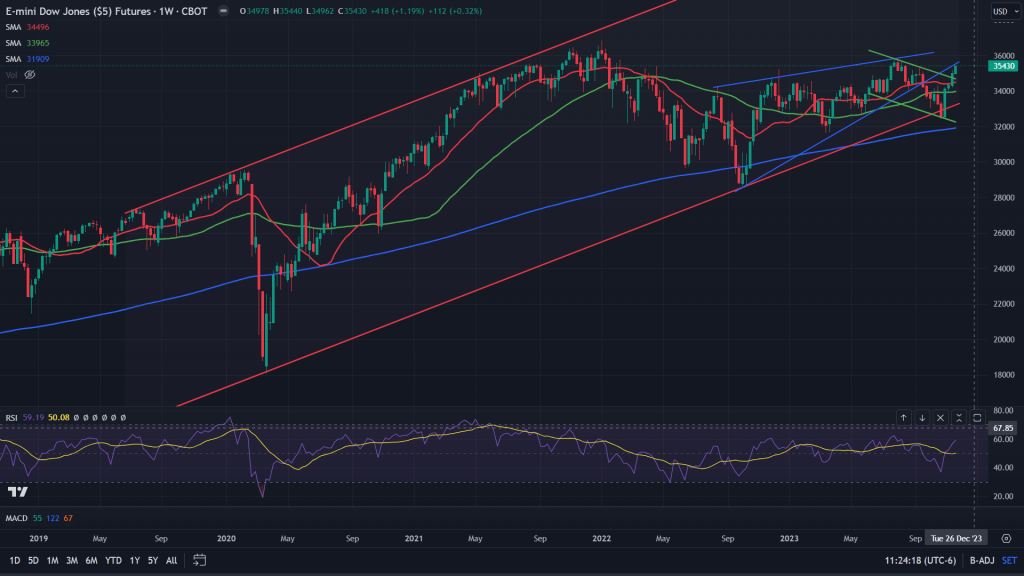
YM (Weekly): Zoom out and we get a picture that the breakdown that we saw, which failed, is the reason why this rally may still have some legs. After this correction, which is due, expect the rally to ensue.
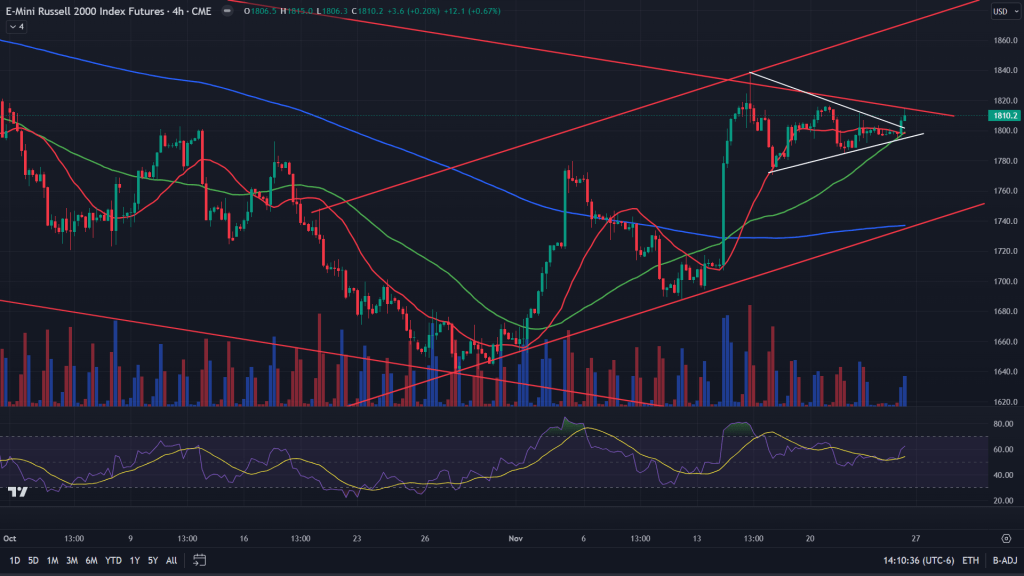
RTY – Russell 2000 Index futures (4H): Triangle breakout tells us that RTY would diverge from others as and when they breakdown off their respective wedges. Expect RTY to outperform during first half of the week and then we’ll see of this ascending channel has topped out? Or would bigger breakout play a role?
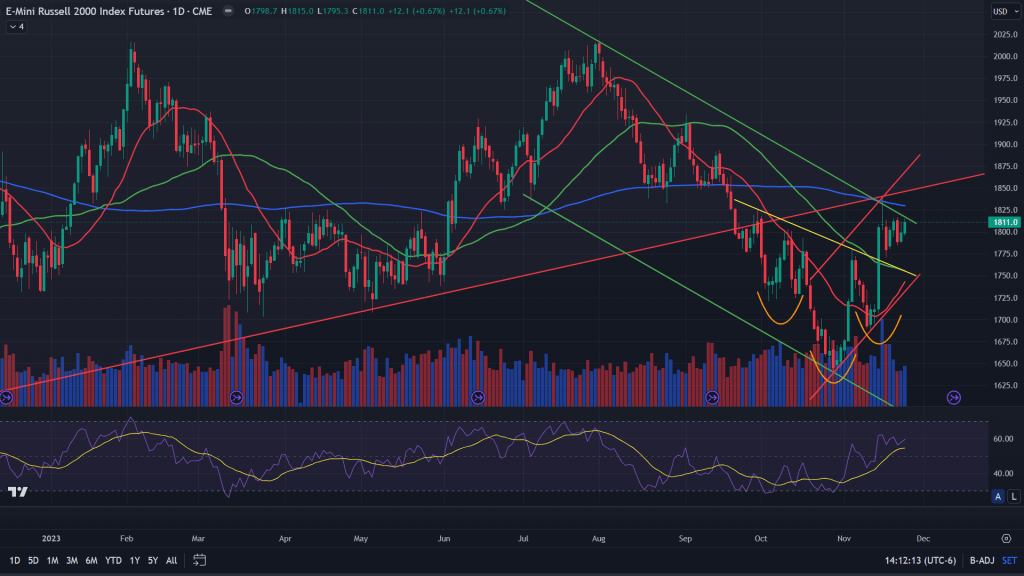
RTY (Daily): Just like the YM, even RTY has a lot going on with it on the daily and weekly charts. First the daily: 1) Right under the channel resistance, 2) Right under the 200 MA, 3) Backtested the bigger breakdown and consolidating ever since. The key here is, the backtest of the bigger breakdown (red channel), is done second time here and it has been consolidating right underneath, which tells me its not yet done with the rally. Expect 200 MA to cross past.
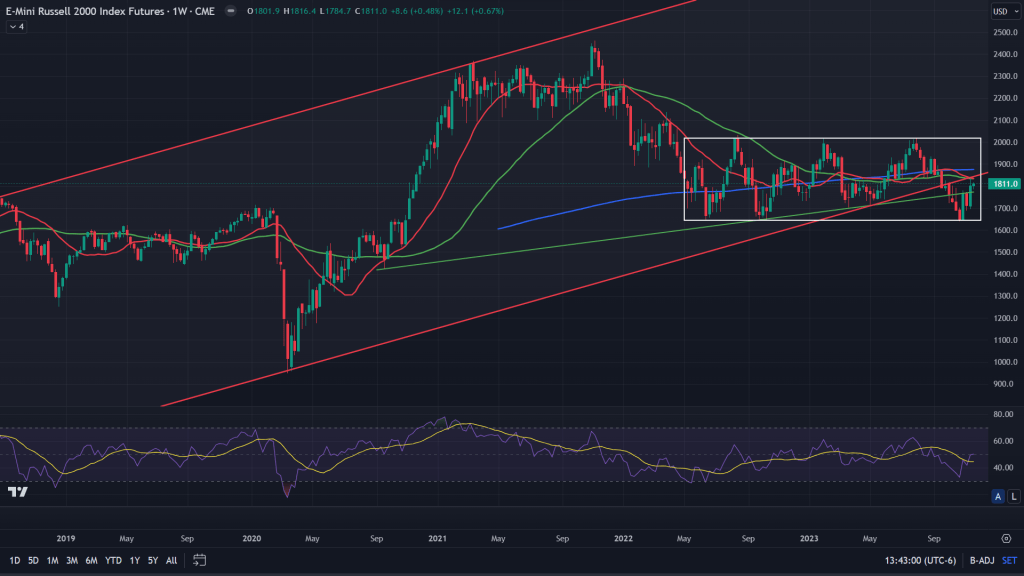
RTY (Weekly): Zoom out into the weekly chart the picture is more clearer. Not only has it been backtesting the channel breakdown. It is also mean reverting the 20, 50 MAs of the weekly along with 200 MA of the weekly. That is not all, for more than a 18 months the index is within this boxed range of 20% (white box). Something bigger is afoot here.
Conclusion: While I would be bearish on the ES, NQ and YM for the first half of the week, I would actually be bullish on the RTY. Though, longer term, doesn’t look as scary as it was few weeks ago. Unless something bigger is afoot (deflation, recession, hyperinflation, stagflation), I wouldn’t expect markets to fall off the cliff just yet. At least not in the next few weeks.

Leave a comment