For those who have been following the blog regularly, they know that I do this commodities update once in a while and it has been long time since I took a deep dive into this world to understand what’s happening out there. Lets drive:
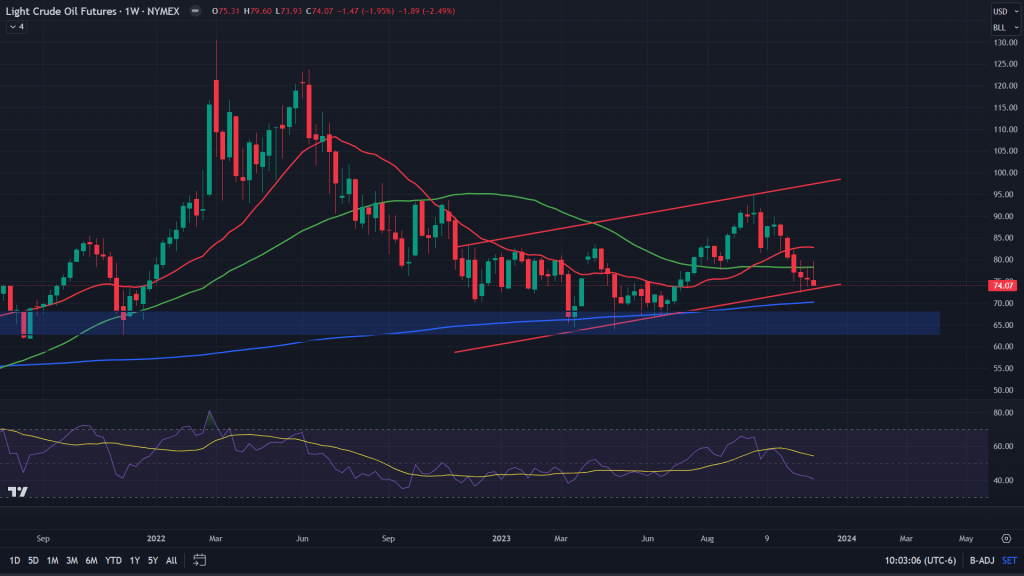
Crude Oil (WTI Crude oil futures Weekly chart): While I keep posting about my views on crude oil quite frequently on twitter/X, but that’s more of a trading call. Today, more than a trading call, its about a view that would go a long way into forming the basis of what lies in the energy sector, as well as for the economy.
Crude oil has been falling for about six wees now, as visible in this chart below. While it has fallen, it has come all the way down to the lower end of this channel which has been forming for a very long time now. While I would expect it to show some resilience here, I wouldn’t expect it to rally all the way up to $90/bbl. Not anytime soon. If anything, it is pretty much likely to break down off this channel and test 200 weeks MA as well as the demand zone of 62-68.
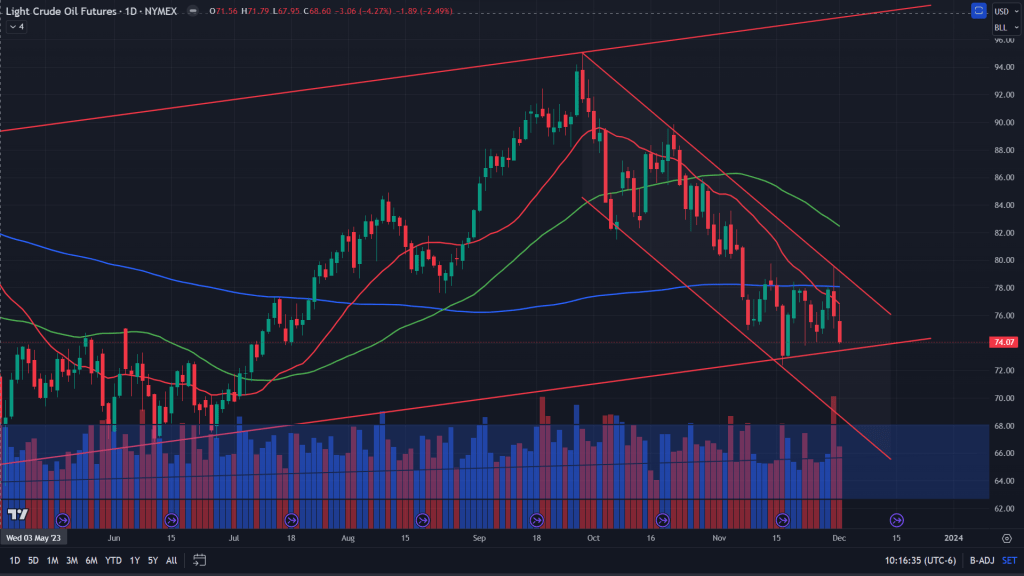
Crude oil futures (WTI Crude – Daily chart): Daily chart shows furthermore clearer picture. It has been hovering around that 20 MA of the daily for a few days now, but in the last 2 days it just gave up. No matter how bullish the production cuts announced were, it only exacerbated the sell-off! Volumes have been high too. Expect the weakness to continue to weigh on WTI crude oil futures in the coming days/weeks.
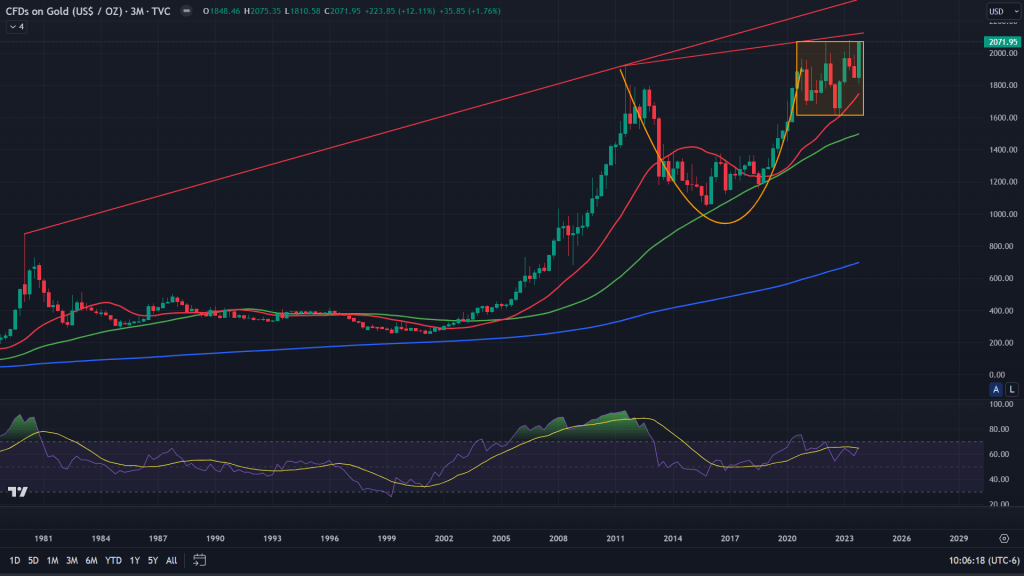
Gold futures (Quarterly chart): Gold has been making all the noise and glitter for last few weeks now. We start our analysis based on the quarterly charts first before zooming out towards the lower time frames. That cup and handle has been talked about a lot many times. Entire world has been watching it, especially during those inflationary days of 2021-22. Expecting the breakout which never came. If any, it rallied, made new highs and sold off only to make another beautiful base. It is back at it now, on the verge of breaking out of this base/handle.
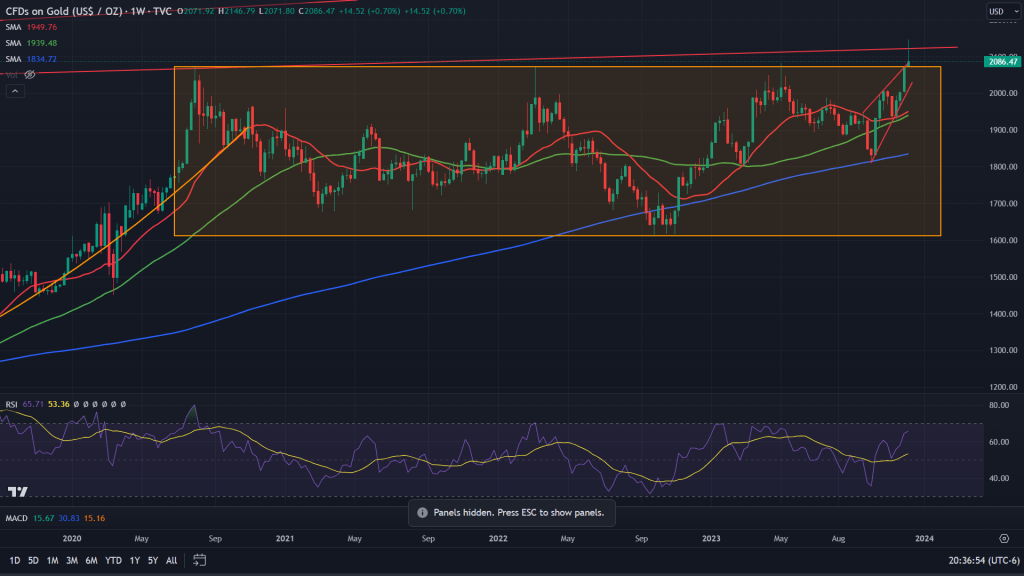
Gold Futures (Weekly chart): It has been stuck in this base for last 2 years and now is ready to break out of it. But is it time to cheer or be fearful? Yes the breakout is almost here for us to cheer about, but if we look closely, it is staring at another key trendline resistance which is just right above the boxed zone at 2125-30 area. So even if it breaks out of this boxed zone, there will still be some resistance to be feared for the goldbugs to worry about.
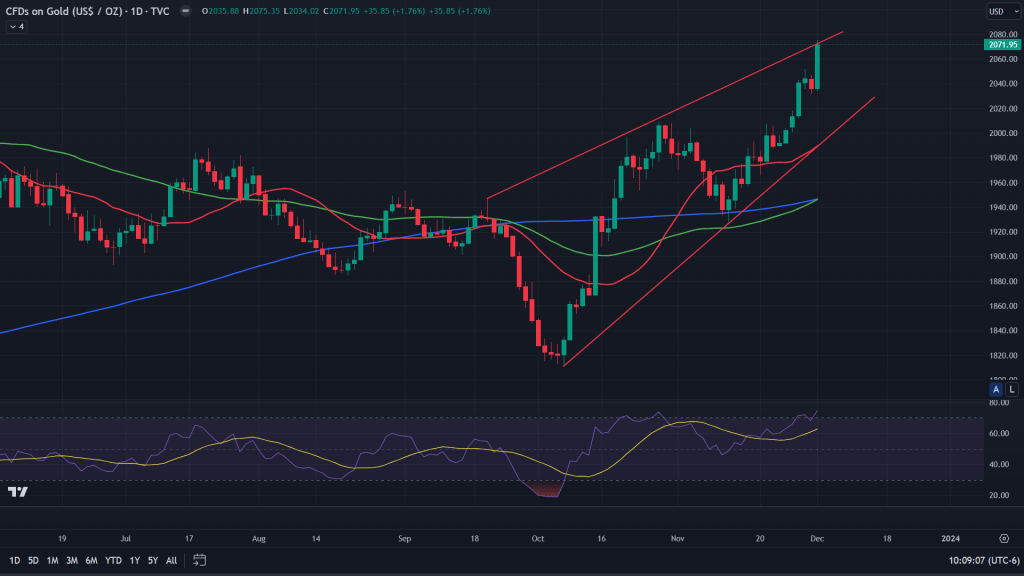
Gold Futures (Daily Chart): On the daily chart, it’s been forming a rising wedge and sitting right at the upper end of the wedge. Expect some cool-off before it heads up again. Although its a rising wedge, which is bearish on breakdown, but its still some time before it breaks down.
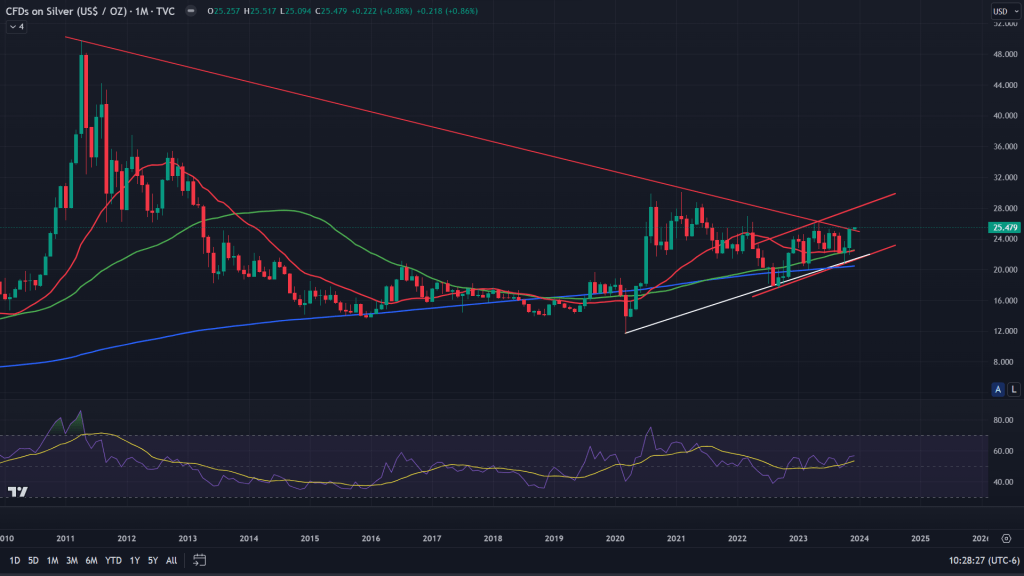
Silver futures (Monthly chart): There is another shining metal that deserves a glitter galore – Silver. More than a decade long trendline resistance has been broken out of and deserves to be added to the portfolio. Next few months look bullish for silver.
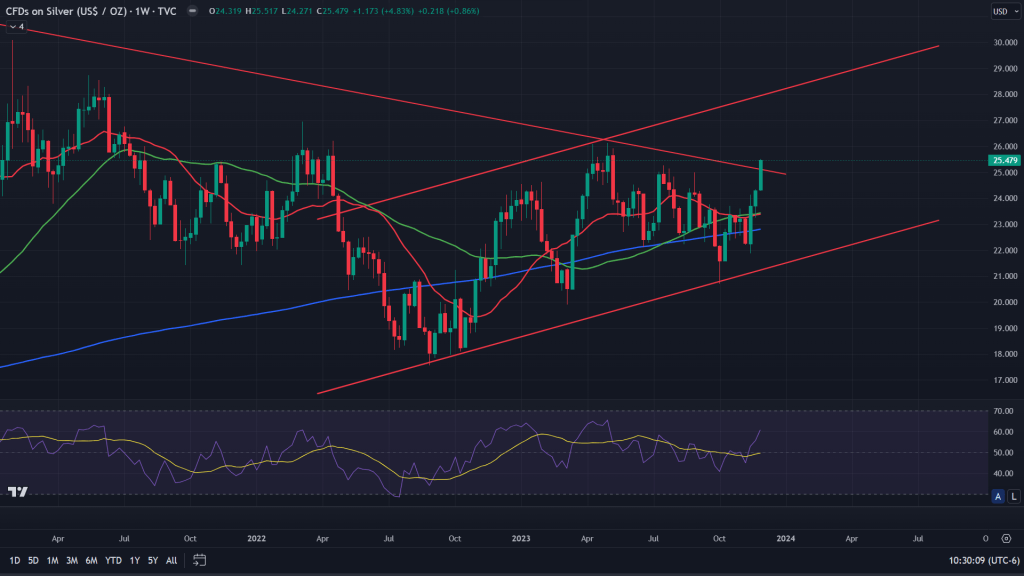
Silver futures (weekly chart): Long term breakout is far more visible on the weekly chart and its rising beautifully within this channel. Expect the fireworks to continue. Initial stop of this breakout could be somewhere around 27 before giving any meaningful backtest.
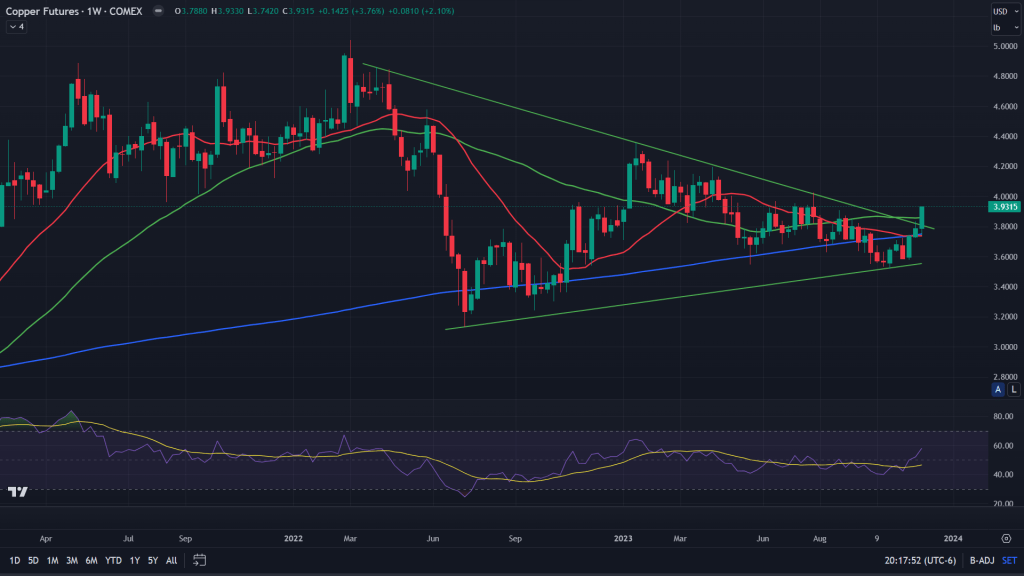
Copper Futures (Weekly chart): If silver has, so has copper. Breaking out of this consolidation of a triangle of last 2 years and could result into a 10-15% rally in the weeks ahead.
Conclusion: The way all these commodities are behaving, it has a message for the broader market and the economy, if you notice. Expected rally in silver and copper, after the breakout tells me that there is strength in the industrial sector as both are industrial commodities. Breakout in Gold tells me perhaps there is a recession/stagflation ahead. Crash in copper tells me there is a demand plunge staring at us. A demand plunge usually occurs at the time of a recession. One of those views wouldn’t hold true. Either copper and silver would continue to rise in a recessionary scenario (very unlikely for copper at least, while silver still can as it follows the footsteps of gold at times), or crude and gold both would reverse the course from their individual current path. Interesting times lie ahead! If you lose sight, you would miss the train!
Weekly US markets update video:

Leave a comment