2023 is coming to end and we are headed into the new year with bated breath hoping and believing the new year treats us well. With those gleaming eyes of hopes and faith, lets take a deep dive into what lies ahead for us, with this 100-year chart of SPX. This post today is not intended to give answers, rather it would help us ask certain questions that we as investors must ask before taking a decision whether to be all in or all out.
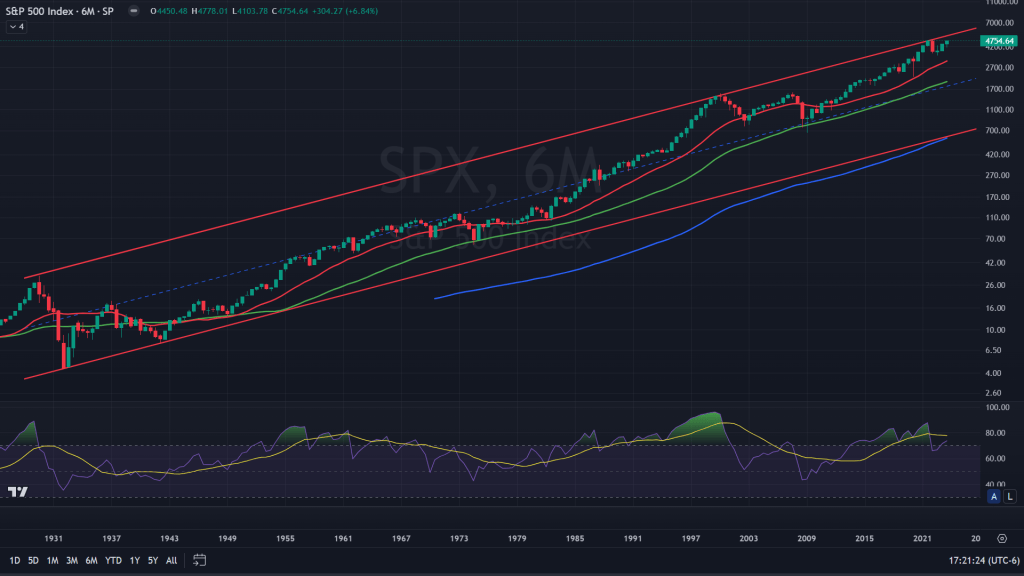
SPX (Six monthly candles): Looking at this log chart of 100 years, when was the last time the price touched lower end of this channel (doesn’t mean it must)? When was the last time price mean reverted on the 50MA of the six monthly candles? RSI being so negatively diverged, what gives confidence for investors to be all in?
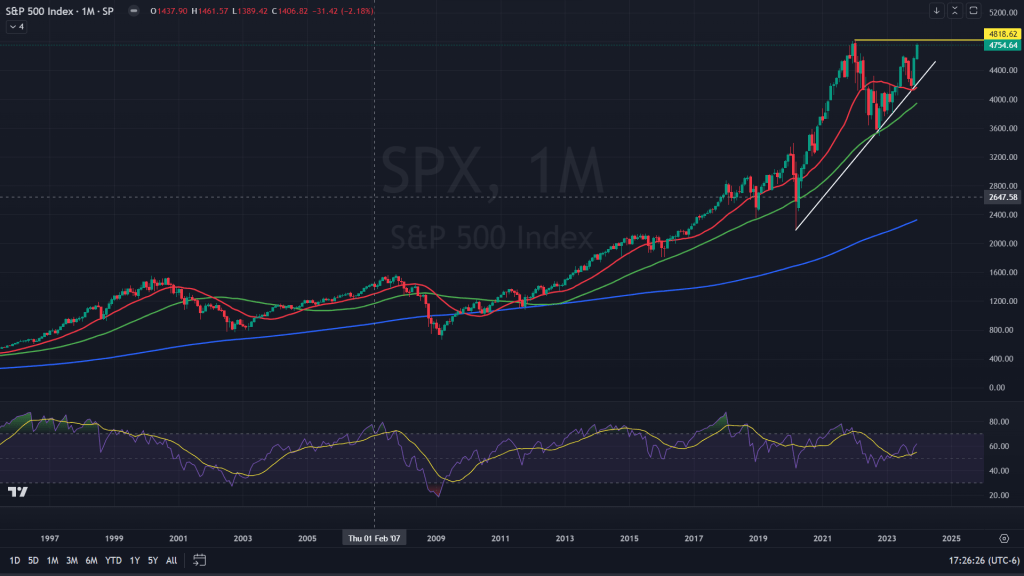
SPX (Monthly candles): Moving away from log chart to the regular chart on the monthly candles, it is interesting that Nasdaq and Dow Jones have claimed new highs, but SPX has still not. It is as close as it gets before claiming the victory lap. But when we look at the internals, massively diverged RSI, should we buy or should we move out?
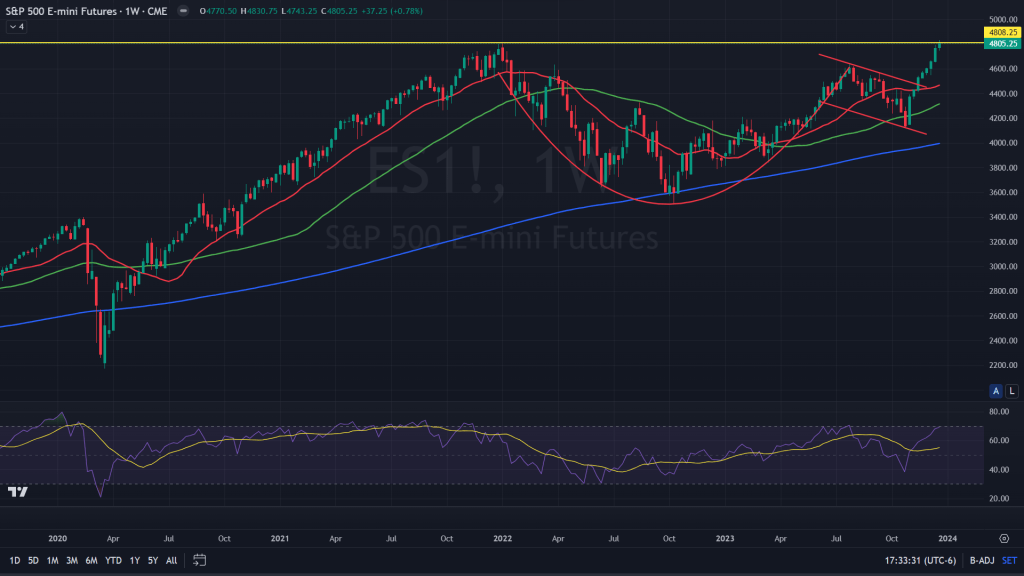
S&P 500 futures (weekly candles): ES futures’ weekly candles have been rising for eight consecutive weeks. When was the last time we rallied for so long and did not have a healthy correction? Cup and Handle breakout has caused this massive rally that’s not looking back even after the new highs. Will sanity ever come back in?
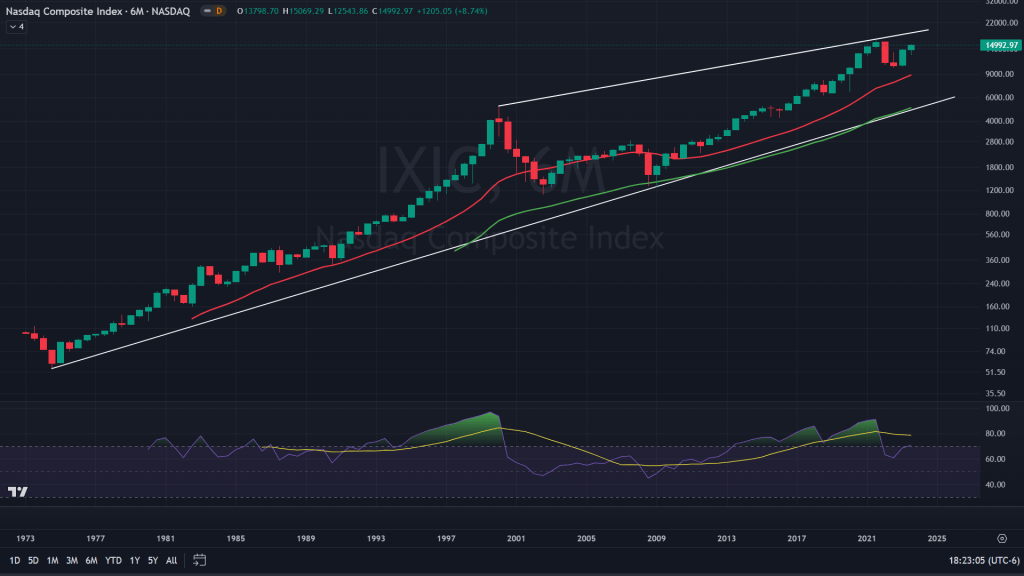
Nasdaq Composite (Six Monthly Candles): Log chart of Nasdaq Composite shows a rising wedge that has been forming for about 20 years now. Prices are close to upper end of the wedge (still far from all time highs). Begs a question – all time high first or a correction? Stretched RSI, negatively diverged on a six month time frame, do you want to buy it here?
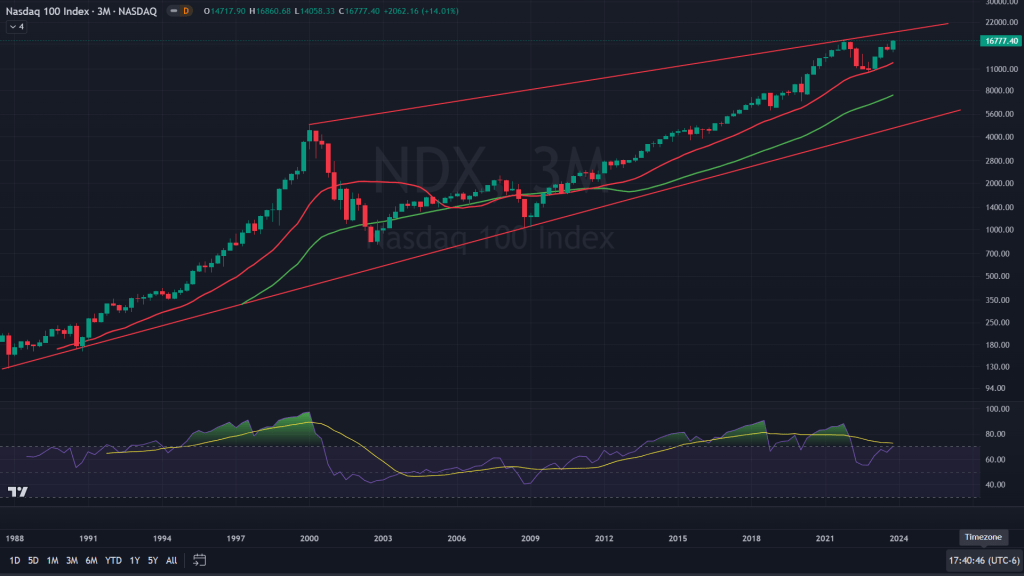
Nasdaq 100 (Quarterly candles): Not just the composite, but the NDX – Nasdaq 100 also has formed rising wedge on a quarterly candle chart with massively diverged RSI. Why would you buy here?
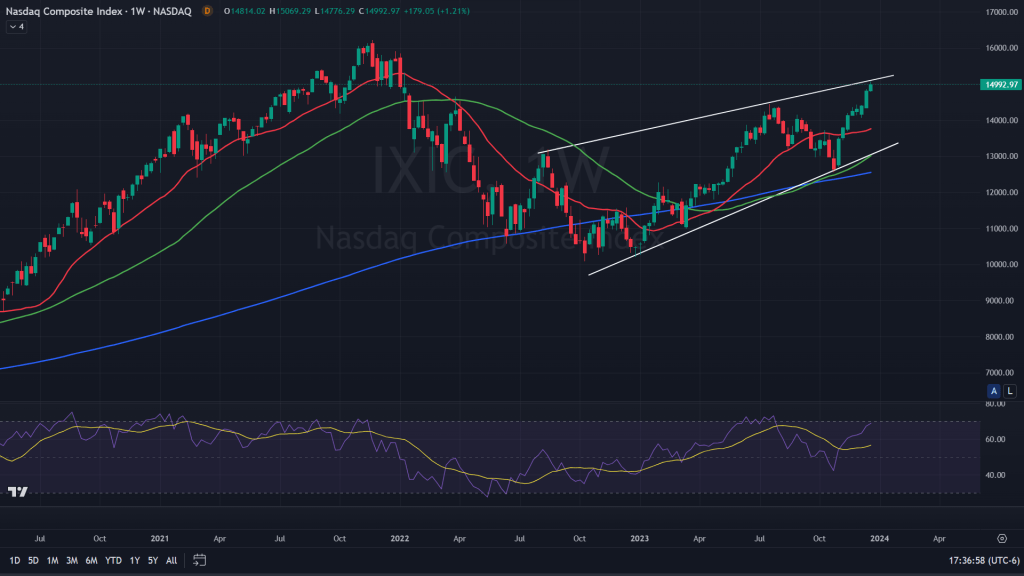
Nasdaq Composite Index (Weekly Candles): On a weekly chart, after eight consecutive weeks of gains, prices are right at upper end of the weekly rising wedge. Tells me, there lies a break before uptrend resumes, if at all. But there lies another question – why Nasdaq Composite has not hit an all time high yet? Only so much for a broadened rally?
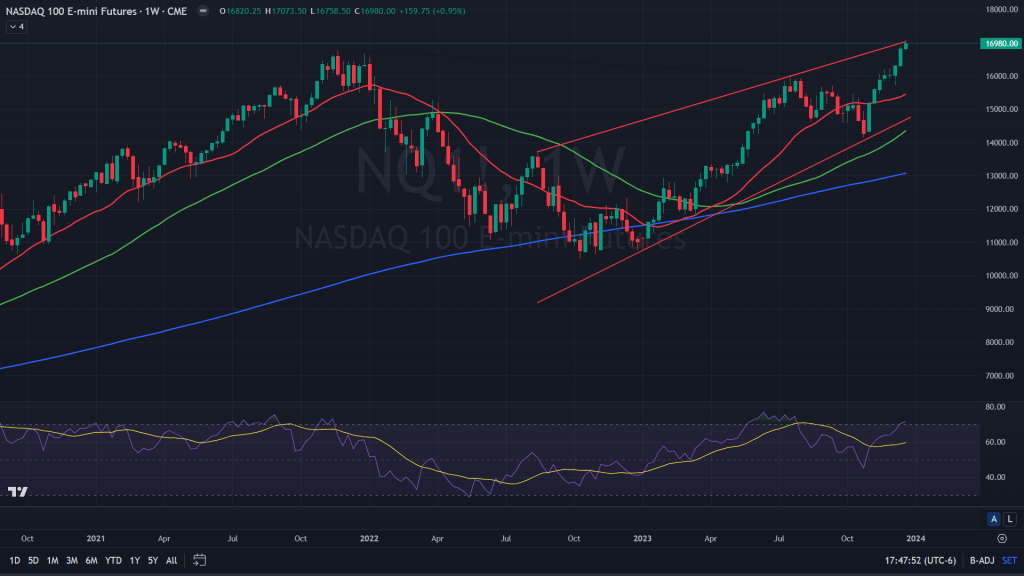
Nasdaq 100 Futures (Weekly candles): NQ – Nasdaq 100 futures are at all time highs but also at upper end of the rising wedge in the weekly time frame, with negatively diverged RSI. Sure, tell me why to buy here?
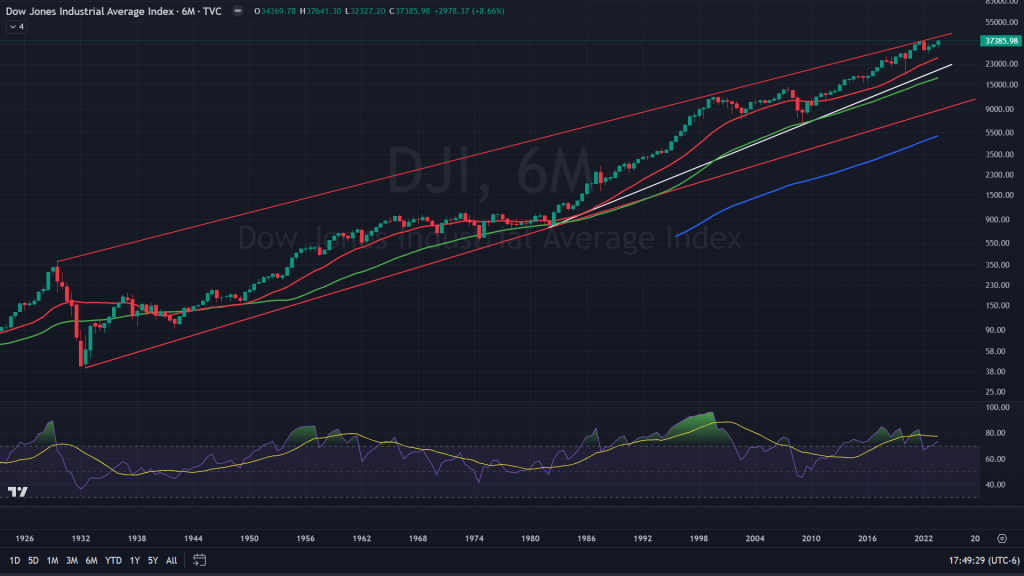
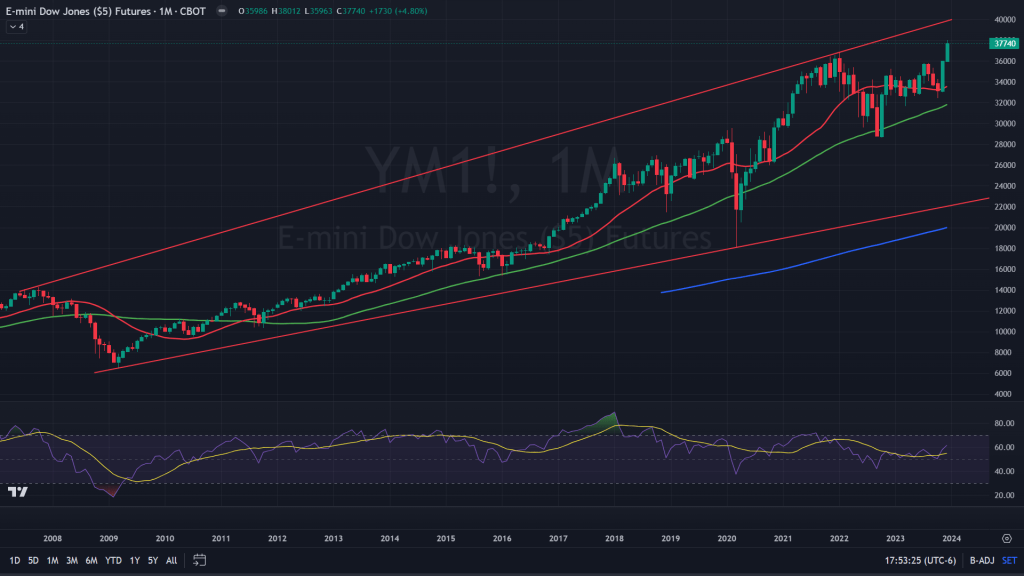
Dow Jones Industrial Average (Six Monthly Candles): 100 years of Dow Jones Index chart begs similar questions – Upper end of this 100-year long rising wedge of the log chart, 20-years long negatively diverged RSI, 50 MA not mean reverted in many many years. Sure you want to buy here?
Dow Jones Futures (Monthly Candles): While Dow Jones has been one of the firsts to hit all time highs, it is inside this megaphone that’s been forming for last 15 years. Can it continue to form and challenge gravity? Or will we hit the upper end again before sanity kicks in?
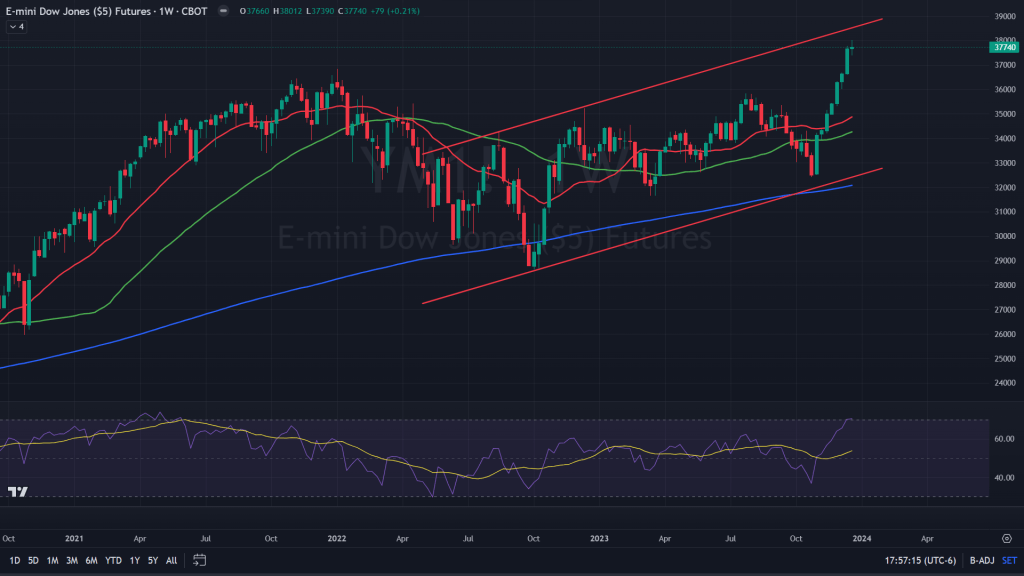
Dow Jones Futures (Weekly Candles): The weekly candles on Dow Jones represent one of the most astonishingly stretched rallies we have seen in our times – eight consecutive weeks of gains! Not far from upper end of the channel, but one question – after eight weeks of gains, can bulls shrug off the weekly evening star formation at the top, which is bearish?
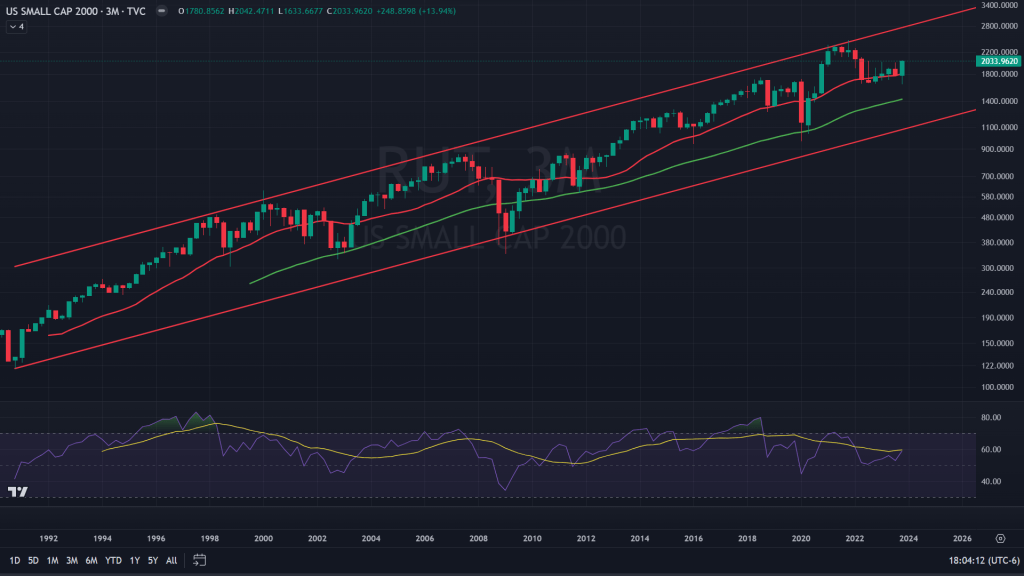
US Small Cap 2000 Index (Quarterly Candles): This 30 years long log chart of small cap index raises more questions than answers. Why is this rally not so broadened? Why are small caps so left behind? RSI still massively diverged. What gives confidence to be a buyer here for long term?
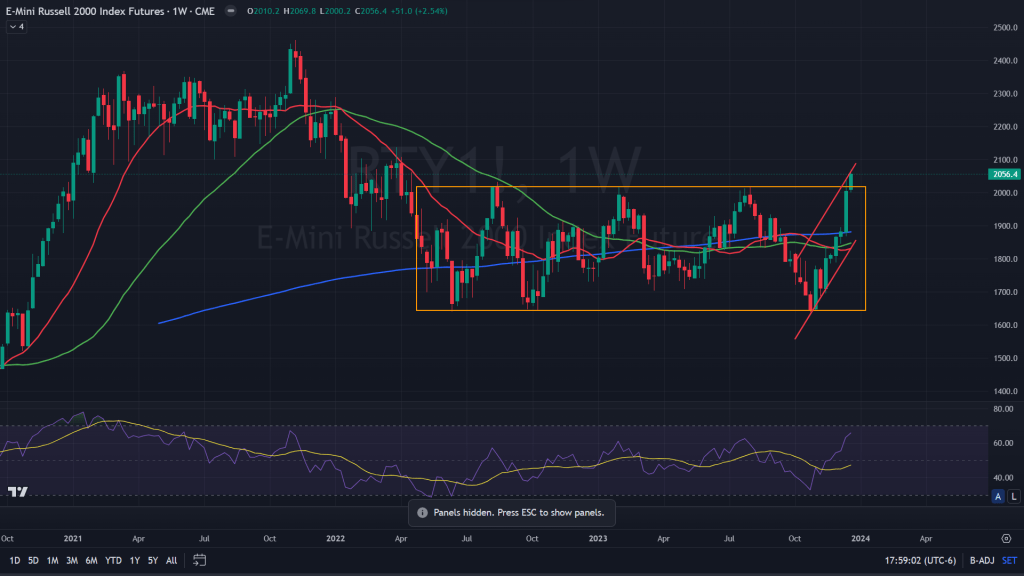
Russell 2000 SmallCap Index (Weekly candles): Weekly chart of the small cap index gives some confidence as there is a breakout visibility. But wait – why is it stuck with this red channel? Right at the upper end of it?
Conclusion: No matter which time frame you look at, there isn’t any confidence in being a bull at current prices. But then I get reminded of this one quote time and again, “markets can remain insane for longer than you can remain solvent.” Barring the next week’s thinly traded markets, I would assume there lies a correction in the first week of January. Whether that would be a long lasting one or just a smaller one before the rally resumes, we will have to see. Couple of questions to leave you all with – when was the last time spot prices (SPX) did not hit all time high, while futures (ES) did? When was the last time markets continued to rally without caring for if its broad based or not (RTY and IXIC)?
Weekly markets update on YouTube:

Leave a comment