What a remarkable year it has been for Indian markets. Almost 20% up on year (19.85% on Nifty to be precise), which doesn’t give exact picture if one were to look at the stocks underneath, such as Nifty Small Cap Index, that has risen more than 55% on year! With such stellar performance behind us, let’s take a look at what the year ahead has in store for us, from technical point of view!
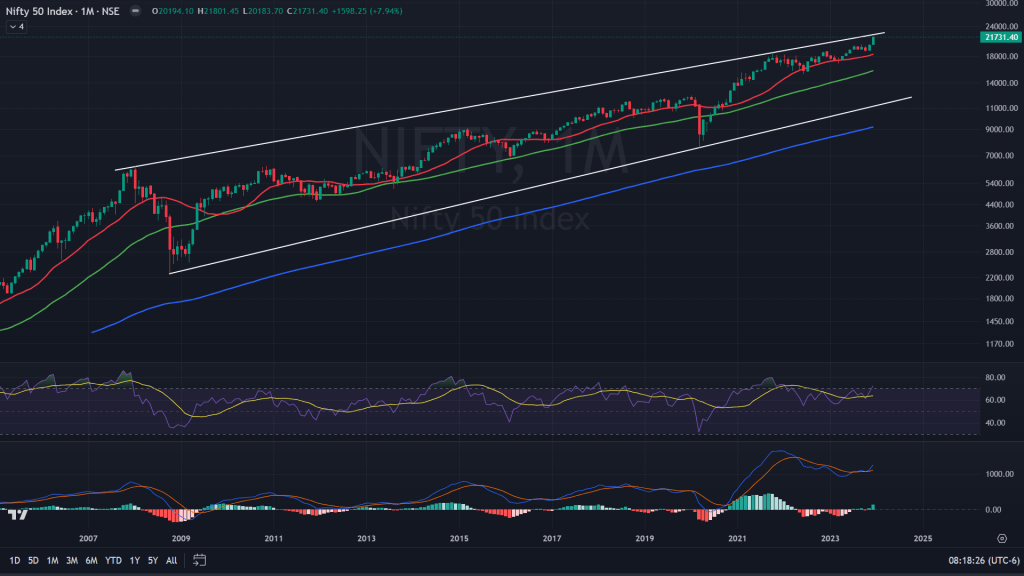
Nifty 50 (Monthly candles, log chart): We have spoken about this chart few weeks ago and it does make sense to look at it from fresh perspective for the coming year. Nifty is exactly around the upper end of this rising wedge on the log chart along with negatively diverged momentum and strength indicators. It is prudent to move out of the long positions for some time and let sanity and gravity work its way out. Even on the weekly and daily time frames, secondary indicators have long been negatively diverged. Certainly not a healthy sign to stay long in the market.
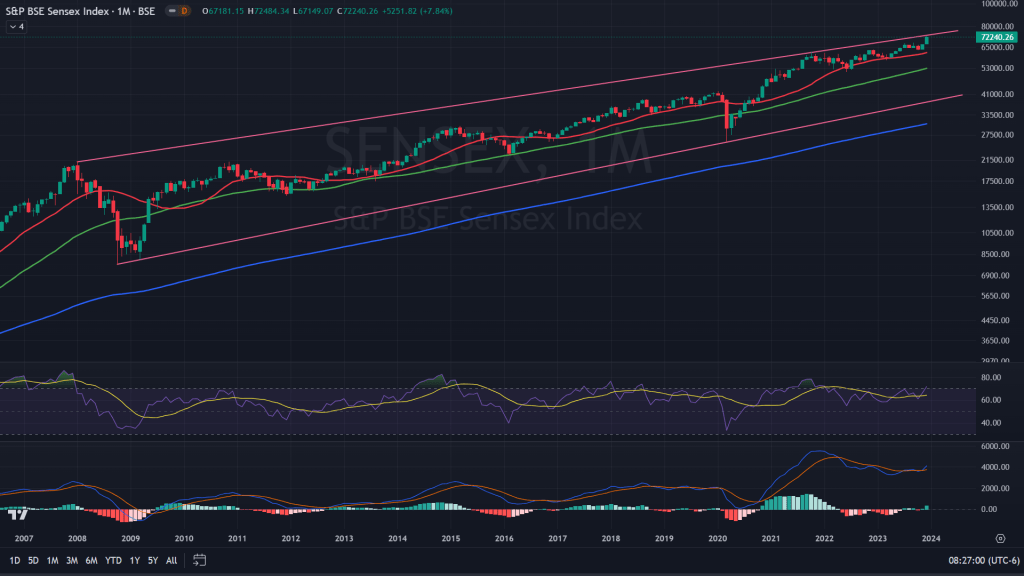
Sensex (Monthly candles): Sensex and Nifty are almost in sync with each other on all time frames and have a similar conclusion – move out of the way and just stay out for sometime before sanity kicks back in.
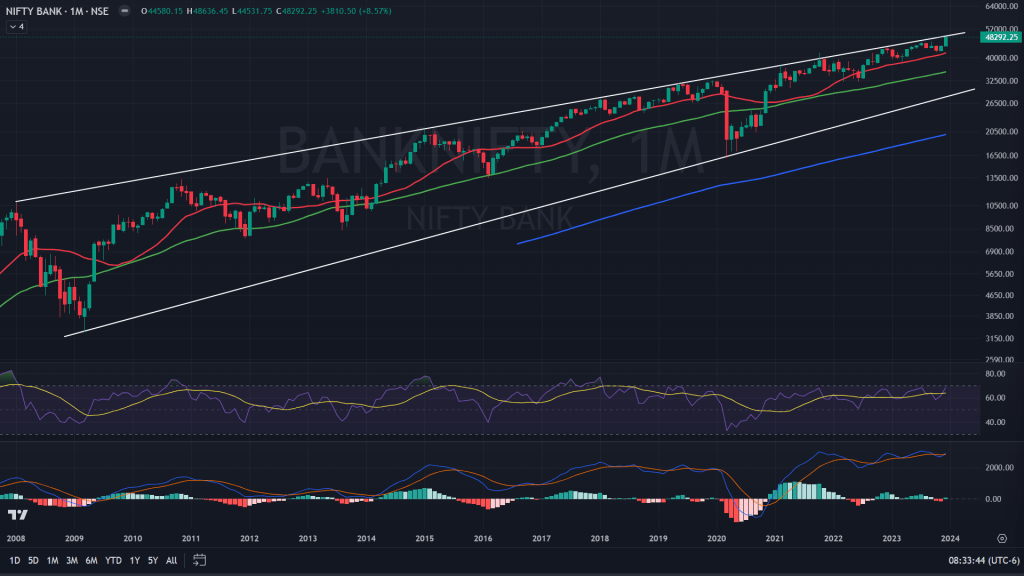
BankNifty (Monthly candles): Banknifty has been flagging red signals for a while now and pretty similar to Nifty and Sensex chart, warning us to stay out of the longs.
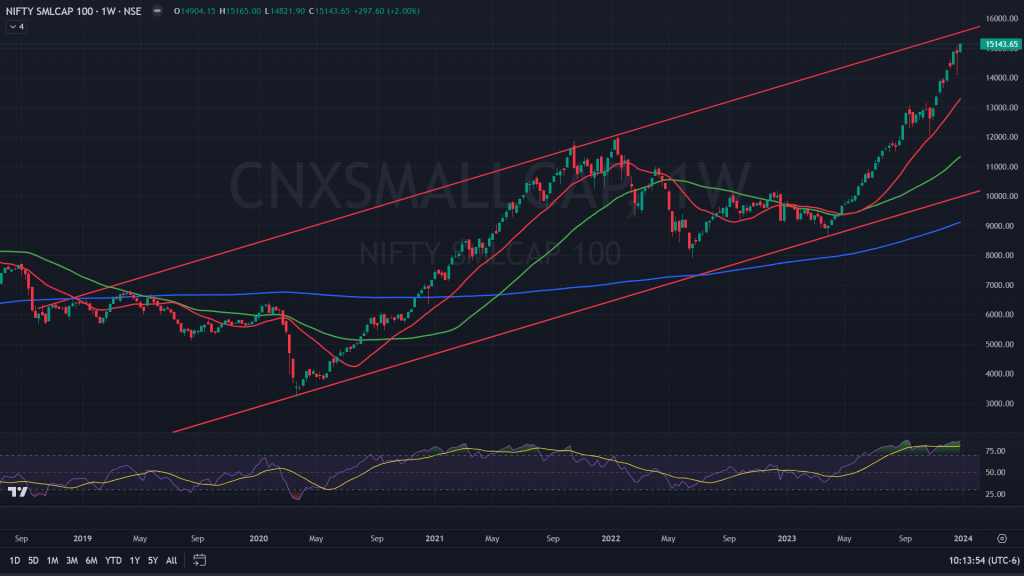
Nifty Small Cap Index (Weekly Candles): When we look at small caps, which have risen vertically in the year gone by, it is almost near the top end of its rising channel and telling us to be cautious on those small cap stocks as secondary indicators are flashing warning signs too.
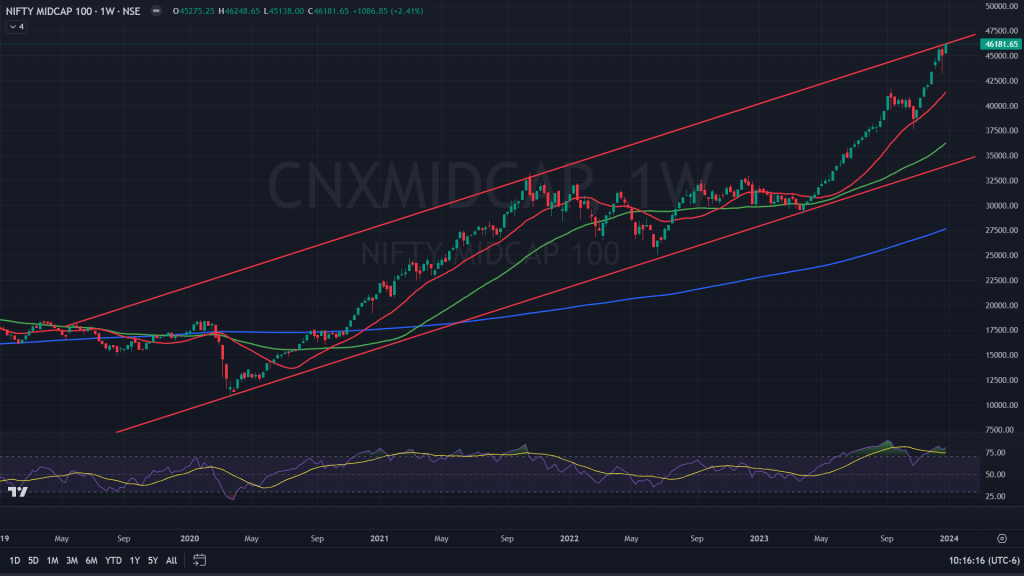
Nifty Midcap Index: Nifty Midcap index, which has also given close to 50% returns in the year 2023 is pretty similar to that of its smaller peer and is exactly at upper end of its rising channel. Strength indicator pointing towards stretched and negatively diverged, yes its not pointing to any healthy signal too.
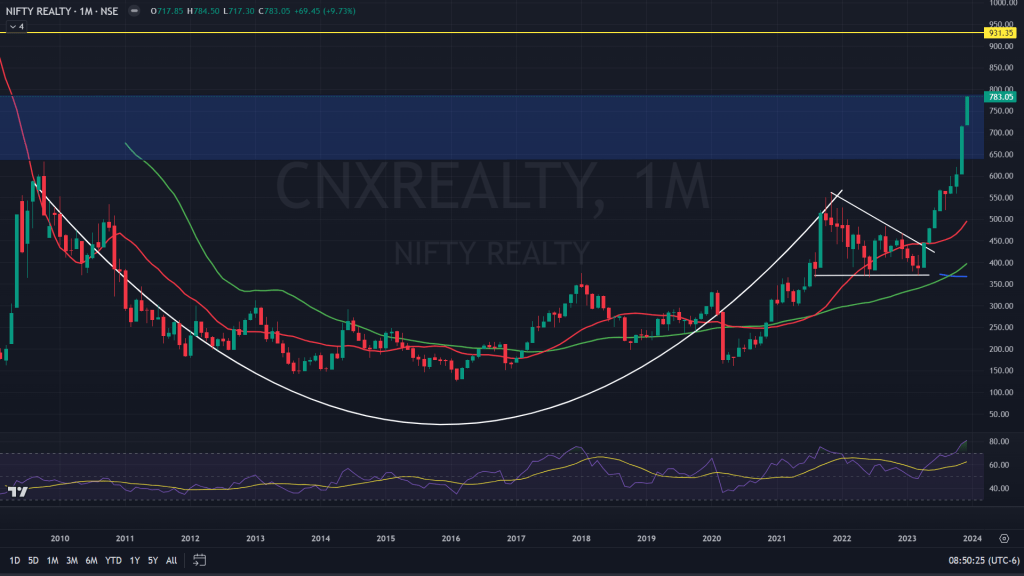
Nifty Realty Index (Monthly candles): We have mentioned Realty Index in the past on Twitter as well as on private discussions with many investors when it was still around 420-440 range, around the breakout point of this beautiful cup and handle pattern, which is done with its rally and its time for investors to be cautious on their holdings in realty names. Although, there still lies a possibility to cross past this supply zone where it is at and touch another strong resistance part of 930, but I wouldn’t hold my breath for that and I would certainly move my positions out of realty stocks.
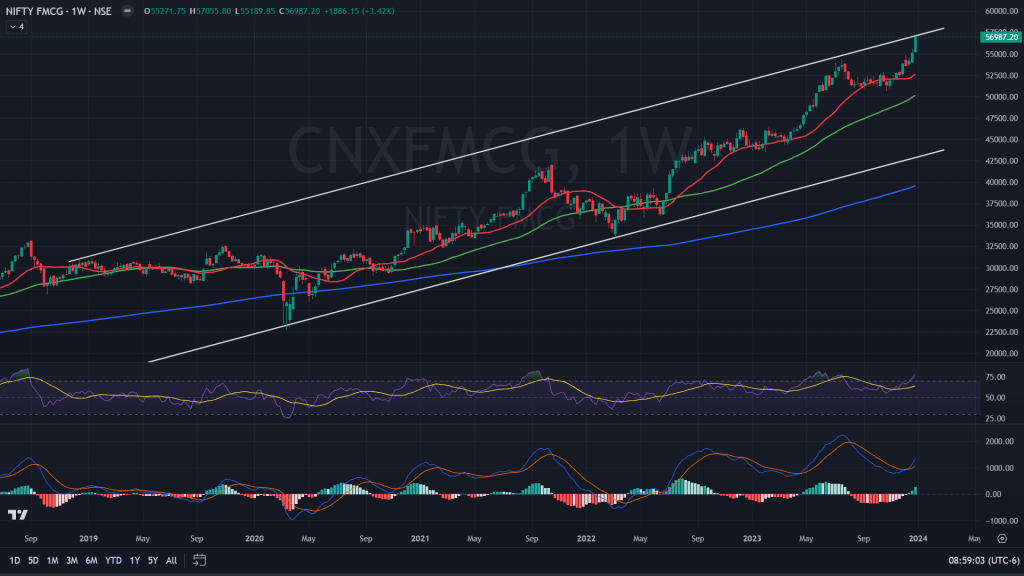
Nifty FMCG (Weekly candles): Another sectoral index with the signs that it wants to take a break from the run! Nifty FMCG index is at the top end of its rising channel along with negatively diverged strength and momentum indicators. Certainly not a sign to continue to hold those longs in here. I would move out.
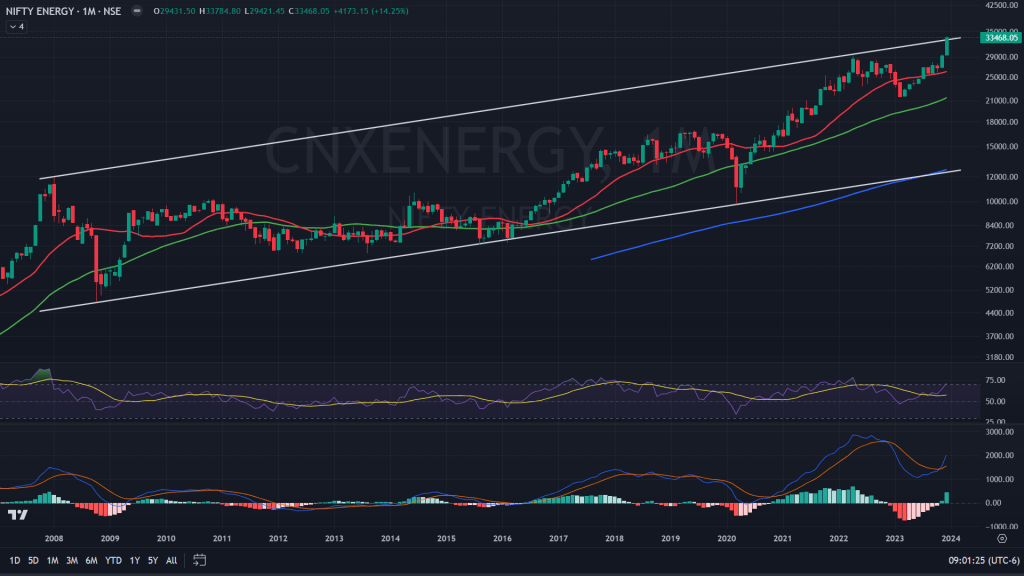
Nifty Energy (Monthly candles): The log chart of Nifty Energy index has similar vibes to that of Nifty FMCG index – upper end of the channel and negatively diverged indicators. Nope, I won’t be holding my longs in here too.
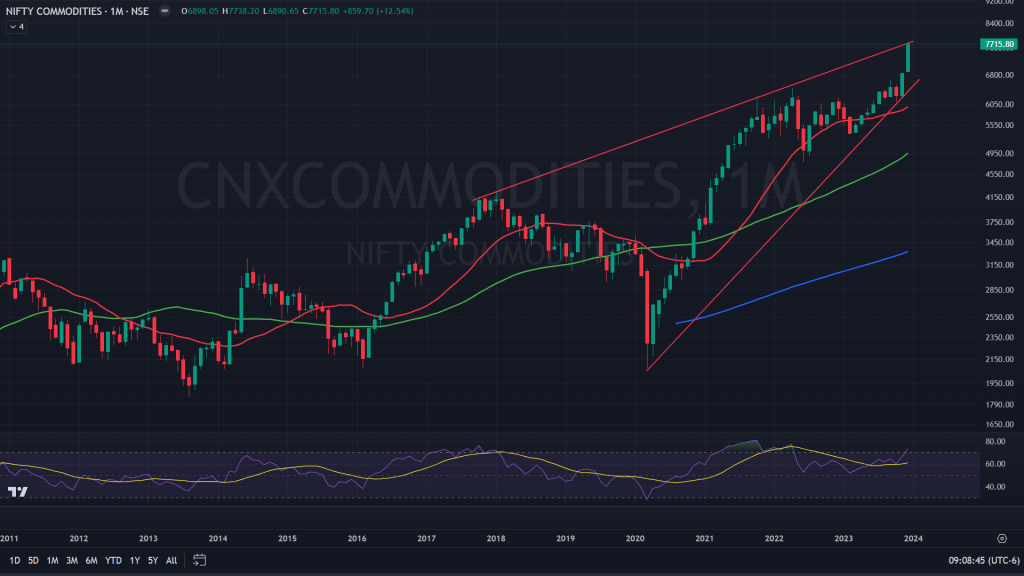
Nifty Commodities (Monthly candles): Nifty Commodity Index’ monthly candles also showing signs of topping out – upper end of rising wedge, negatively diverged RSI. I would not hold it here.
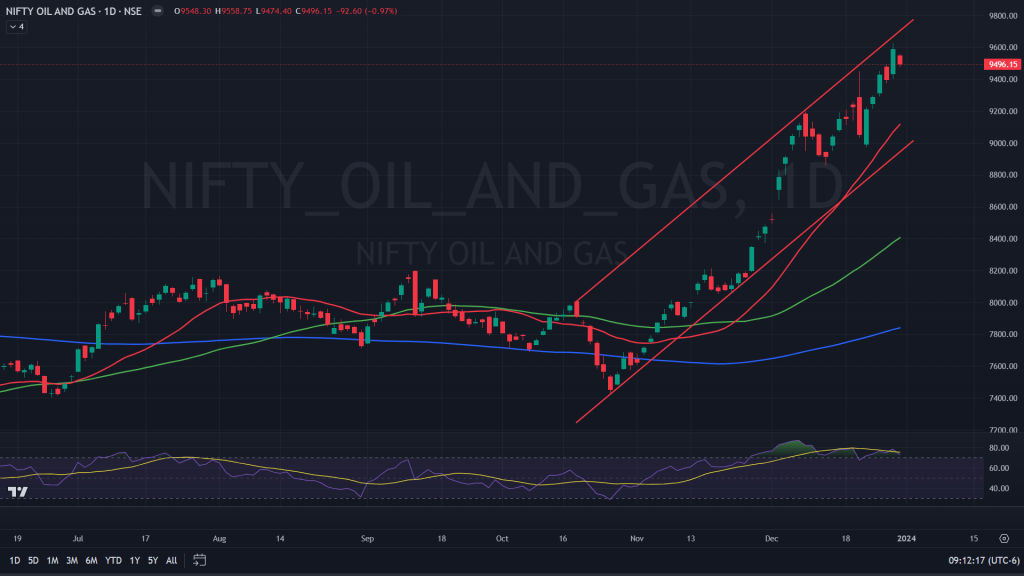
Nifty Oil and Gas (Daily Candles): The daily candle of Nifty’s oil and gas index is peaking out too. Risen almost vertically, within a channel formation and now negatively diverged RSI. I am not holding it here.
Conclusion: While those are only a hand few of indexes, there are many other indexes that have still not shown enough convincing signs of topping out. Not only the index, there are many stocks which are holding just fine even if the indexes therein are topping out. There are some IT, Pharma and Auto stocks which have not shown any signs of topping out yet. What that tells us is – while major markets may start their corrective journey, some of those stocks would still be doing just fine for the next few months. So, even if I would be moving out of my longs in many of those sectoral indexes, there would still be some space left in some other stocks to make money in. Giving enough cushion to major indexes to not fall much. Call it gravity and consolidation at best! Some correction and some consolidation would be the theme of the year ahead!

Leave a comment