There were two important market update I wrote at the end of December 2022 (Markets: The what if and the probabilities) and December 2023 (US Markets: The year ahead – all in or all out?) both were about what to expect in the coming year. While 2023 turned out to be exactly what I thought “could happen”, 2024 seems to be behaving eerily in a similar pattern, and that’s scary.
Hear me out.
When I wrote that update at the end of 2022, the theory was that the entire correction/bear market was only a backtest of the actual breakout that had happened around covid and we have another leg left to the upside. Which indeed came through in a dramatic fashion last year and now that it’s here, there are many more questions that needed to be answered. We asked some of those in the 2023 update mentioned above. But there are some more questions that we seek to ask and try and find some of those answers on an ongoing basis.
While we do that, one key thing to remember – What we try and do here is assigning a probability to what may happen. Read this analysis as only one of those possibilities and not as if ONLY THIS would happen. Because market is a beast and it does what it does the best without caring for what you and I think would/should happen. Let’s dive in:
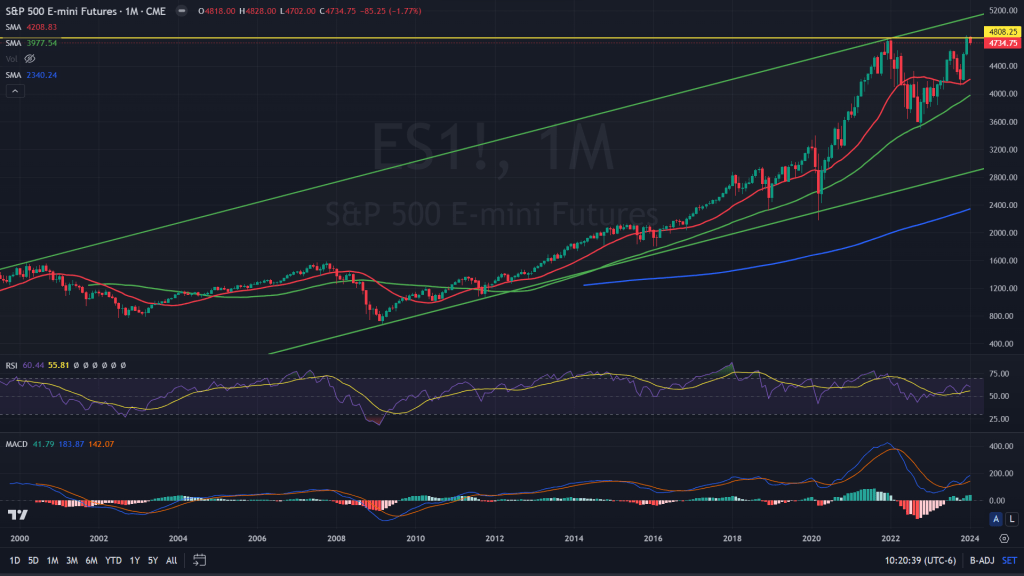
S&P 500 (Monthly candles): When I wrote about the probability of a new high, back in 2022, it was only a probability based on certain factors, which included a breakout, backtest and a possibility of negative divergence on monthly time frames by some key indicators, including RSI and MACD. Now that all time high on the S&P 500 futures is here, there are some key factors that seems to have started playing out:
- Double top: Previous all time high on the S&P future was 4808.25 and this time the new high is 4841.50, good enough to be called a double top on a monthly time frame.
- There is a channel that has been playing out from more than 20 years ago. If you have been following my theory of topping out, you would be able to tell why this channel is showing first sign of a top out, which is inspite of posting a new high, it is far off the upper end of the channel resistance. We’ll have to wait for the monthly candle to finish though before we can comfortably call it a top yet.
- Secondary indicators: It has played out exactly as it should have – Momentum as well as Strength indicators are negatively diverged. Good enough sign to exit longs.
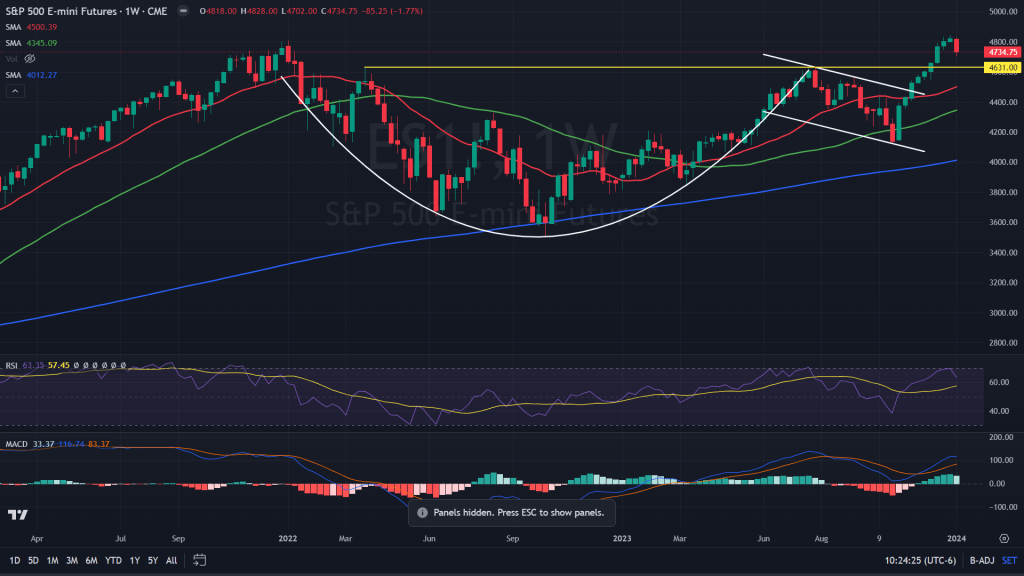
S&P 500 (Weekly candles): When we zoom in to the weekly candles, after nine consecutive and vertical weeks of gains, certainly there was a need for a retracement and a backtest of all those breakouts. Last week’s fall has wiped out previous two weeks’ gains. That’s a tell-tale and I would assume it’s not done with yet. The first key support would be the demand zone of 4625-35 along with weekly 20 weeks MA which is still far off – around 4500.
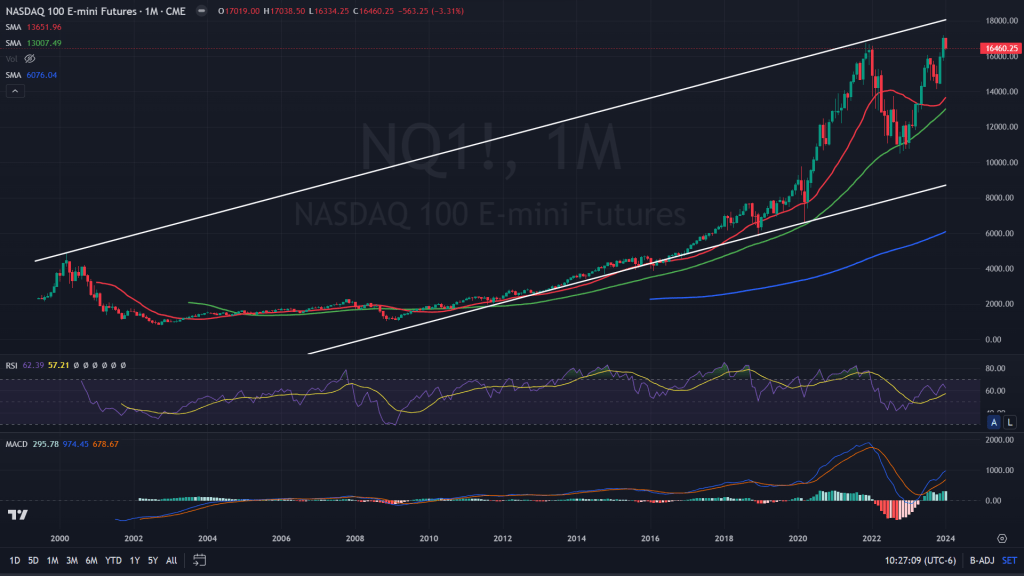
Nasdaq 100 (Monthly candles): The highs of 2021/22 and the reaction after that was wild! But did we know that this top was exactly from the same trendline resistance of a channel that got formed after the dot come high? Interestingly, the high of last few days/weeks has surpassed the previous all time high, but it also starts the process of topping out of the channel. Now here’s something worth pondering.
The process of topping out of the channel and wedge, while works pretty much the same way for all the asset classes and on all the time frames, I would beg to question the veracity of the same on a monthly time frame, that too for an index. Because that would mean a very long term top in place. Probably for decades. That would also mean there is absolutely nothing right with America as an economy from multi-decades point of view. That would also mean, all that we spoke about in this post Where is America headed? Economy, Markets and beyond! is coming true in the very long run.
Coming back to the technical view point, although the month has only started and there is a lot that can and would still happen by the time this monthly candle closes. But as of now, given the formation and the reaction from the top is a sign that market wants to take a break from the rally. Whether it turns into a catastrophic bear market or a shallow correction is yet to be seen and would only be clear in the coming days. More so, once we close past the 20 weeks MA the clarity and confirmation would be better. On the daily time frame though, the view certainly has turned negative. In terms of the secondary indicators, yes they have diverged negatively already. But for us to confirm the negative view of the market from monthly time frame, we need candles to confirm too. The only confirmation as of now is the double top.
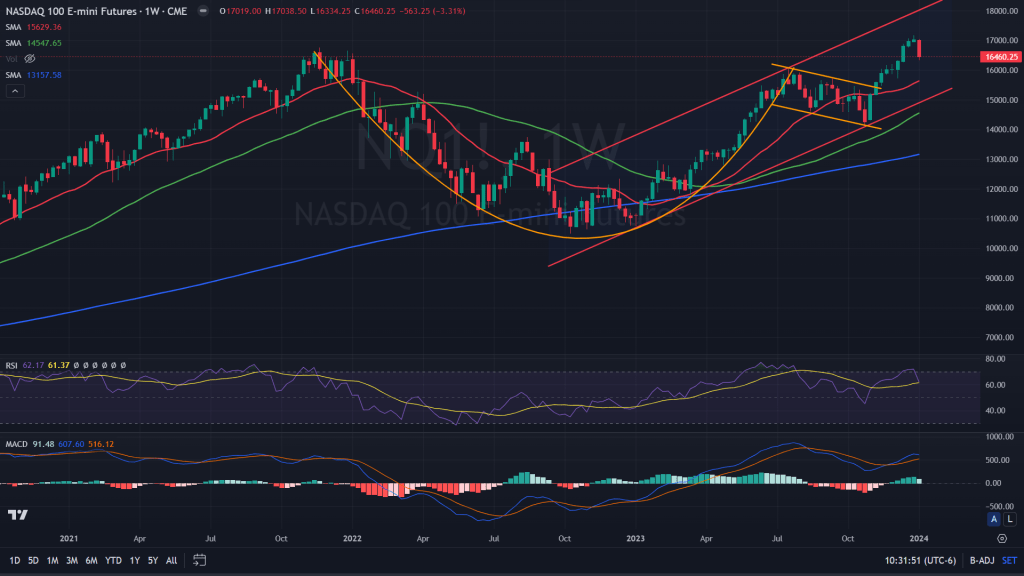
Nasdaq 100 (Weekly candles): On the weekly time frame, there are cracks appearing:
- Nine consecutive weeks of gains in a vertical fashion needed a correction and that is here.
- The bearish confirmation candle after the inverted hammer at the top has wiped out more than two weeks’ gains.
- The channel top out confirmation almost in place, unless next week results into a bullish engulfing candle, although unlikely.
- Negatively diverged RSI and MACD indicators, confirming to be out of longs.
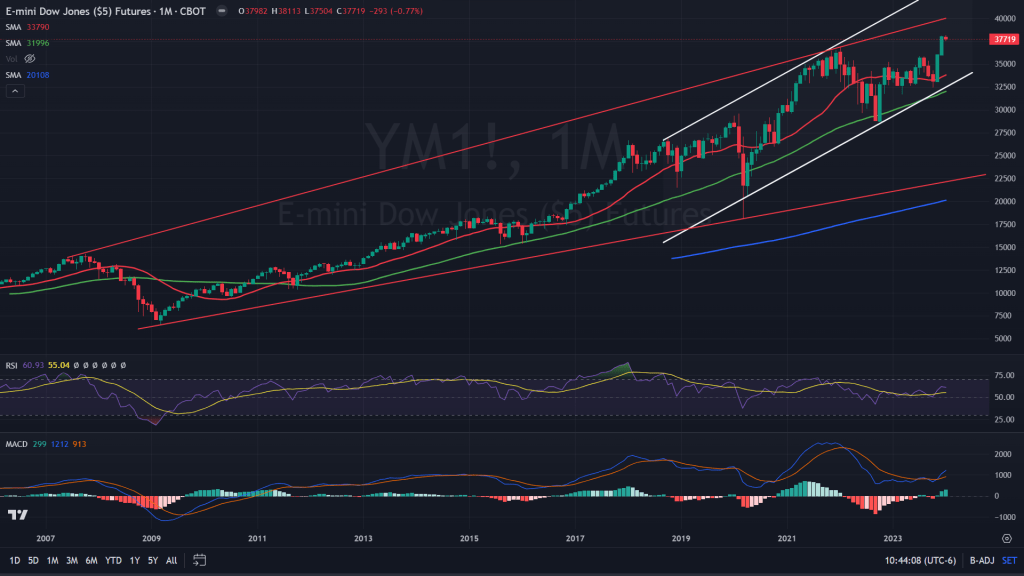
Dow Jones Industrial Average (Monthly candles): The megaphone, the channel topping but the resilience is mind boggling. Dow Jones has led the market when it bottomed out and if market are/were topping out, we would assume it should have led us to the downside too, which is not the case. The shallowness of the fall is a sign, although too early, that probably it would give one more shot to the upside. We’ll need to dig deeper and probably wait a bit more.
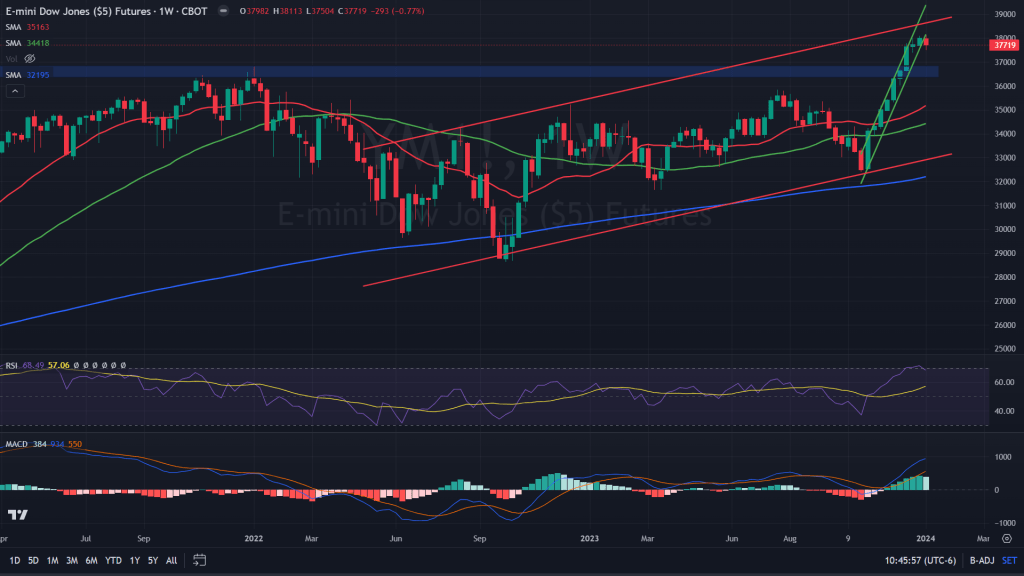
Dow Jones Industrial Average (Weekly candles): Bearish engulfing candle on the weekly after nine consecutive weeks of gains is surely a concern, but the candle itself isn’t large enough for bears to get excited. Even the weekly secondary indicators haven’t diverged yet. Probably couple of weeks more before anything can be concluded on the Dow jones from bearish perspective.
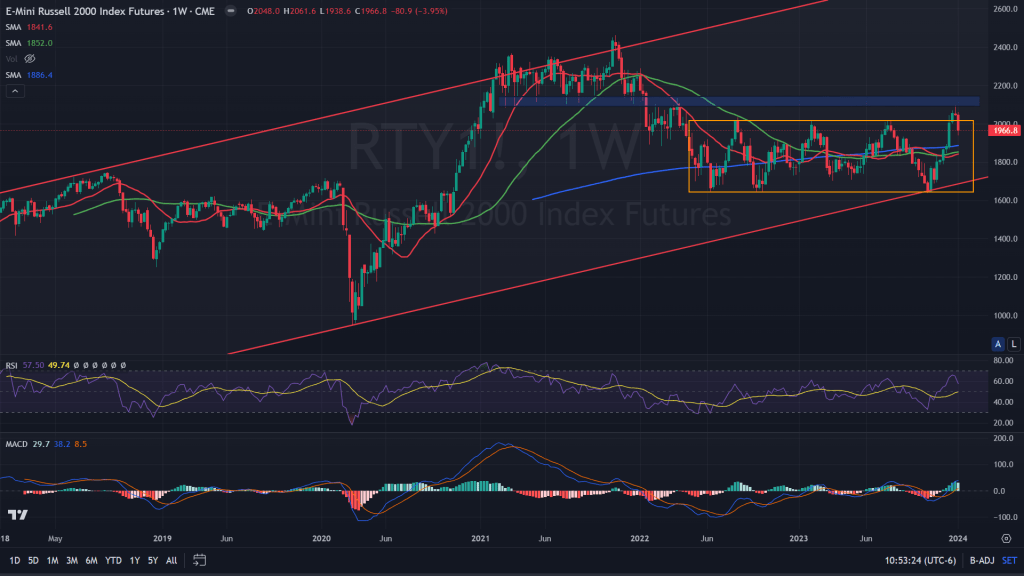
Russell 2000 Small Cap Index (Weekly Candles): Bearish gravestone doji, followed by big large red candle is good enough to convince bears to continue their onslaught on the small caps. Yes, on the weekly time frames, Russell 2000 Index has turned convincingly negative. Even the daily time frame has turned down and has some more pain left before a convincing bounce worth trading.
Conclusion: While very long term view hasn’t yet turned negative, short term has certainly turned out to be shaky, especially on the Nasdaq and Russell 2000 index. There would be bounces in the coming days based on short term time frames, especially 4H candles which have gone oversold, but those bounces would get sold into as there isn’t any good enough support nearby for the bulls to get hooked on to. I would use bounces on the Nasdaq and Russell 2000 to create new shorts.

Leave a comment