What a week it was! Yes it was a week that doesn’t deserve to be remembered. It was a week that came and went by without doing anything worthwhile. Yes there was some movement, but that movement didn’t do much to excite either bulls or bears. How does one trade such markets and what is it that the market is telling us? Let’s take a look:
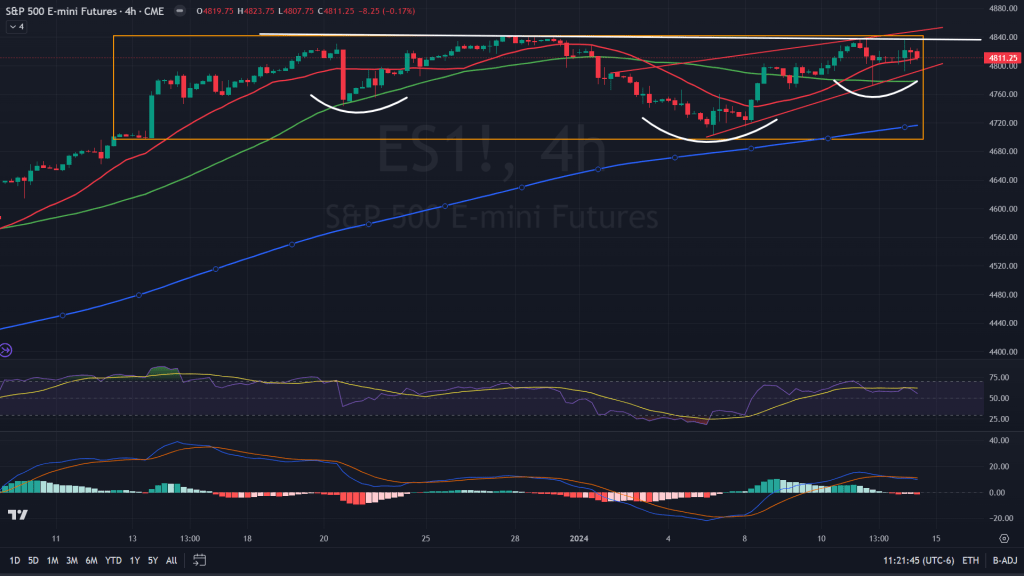
S&P 500 futures (4H candles): Ever since S&P clinched its previous all time high and after a lot of fanfare, there has not been much movement to write home about. Yes there have been some moves here and there that were tradeable, but we could speak of it only in hindsight that it was a ranged play. The range that won’t take us below 4740-60 and above 4840-50. It did go all the way down to 4700, only to quickly be bought by the bulls who were left out of the rally earlier. There are two interesting patterns that have formed in this process for now – inverse H&S (bullish) and rising wedge (bearish). I would guess it would be a breakout first and then may be a breakdown or a backtest of the H&S breakout which would satisfy both the patterns technically.
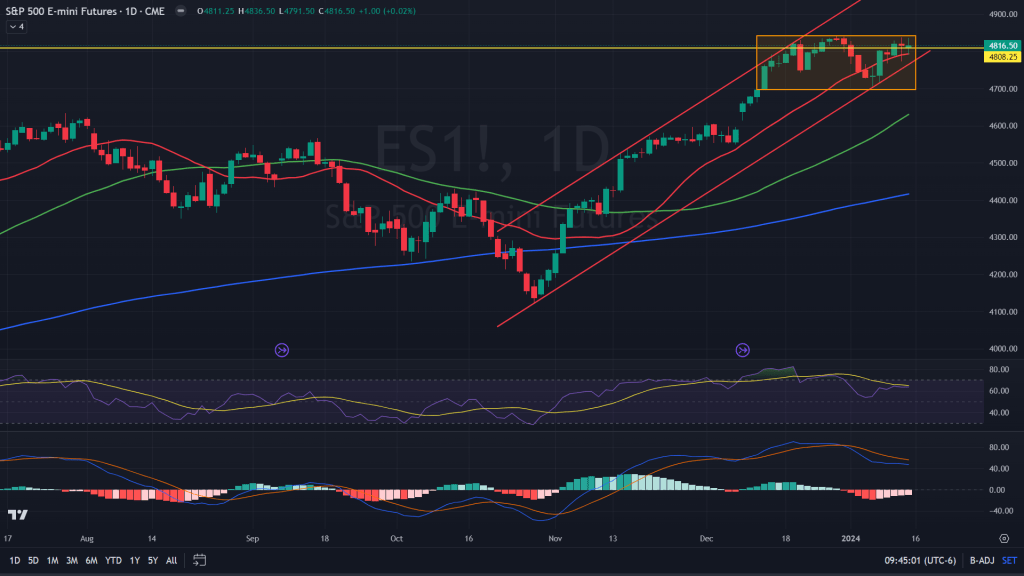
S&P 500 futures (Daily candles): While that yellow line says its a resistance, the box underneath has patience written all over it. Even if there was a rising wedge formation, there is a rising channel formation, it doesn’t look to be breaking down yet as the formation at the top end is more of a high base which usually results into a breakout to the upside, unless January opex (options expiry) changes things materially on January 17th.
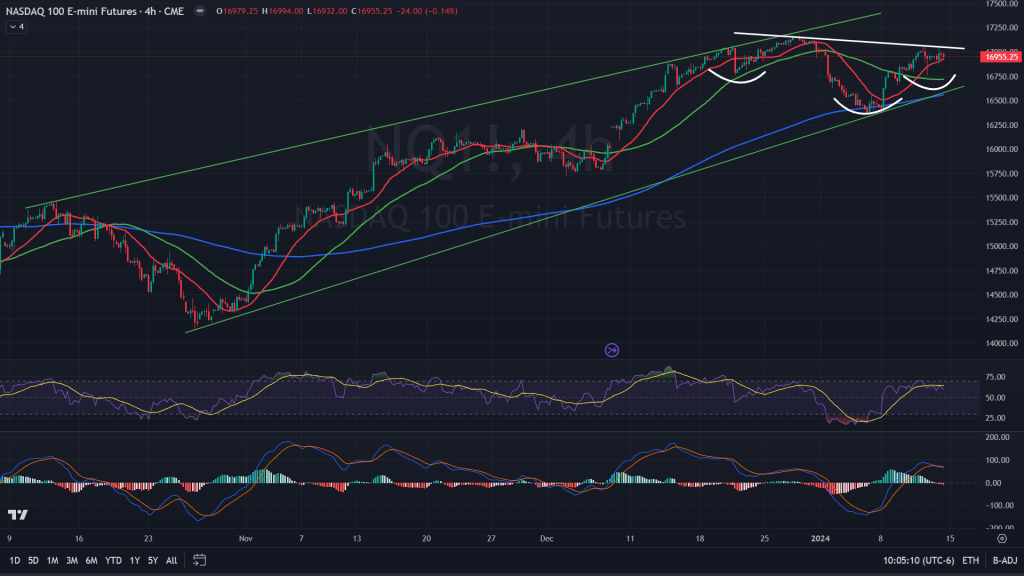
Nasdaq 100 futures (4H candles): Nasdaq has a pretty similar formation with that of the S&P. Rising wedge and an inverse H&S within the rising wedge. One should expect a breakout of this inverse H&S in the coming days and then see how the backtest pans out whil rising wedge is still a bigger pattern, it remains to be seen if and when it would result in a breakdown.
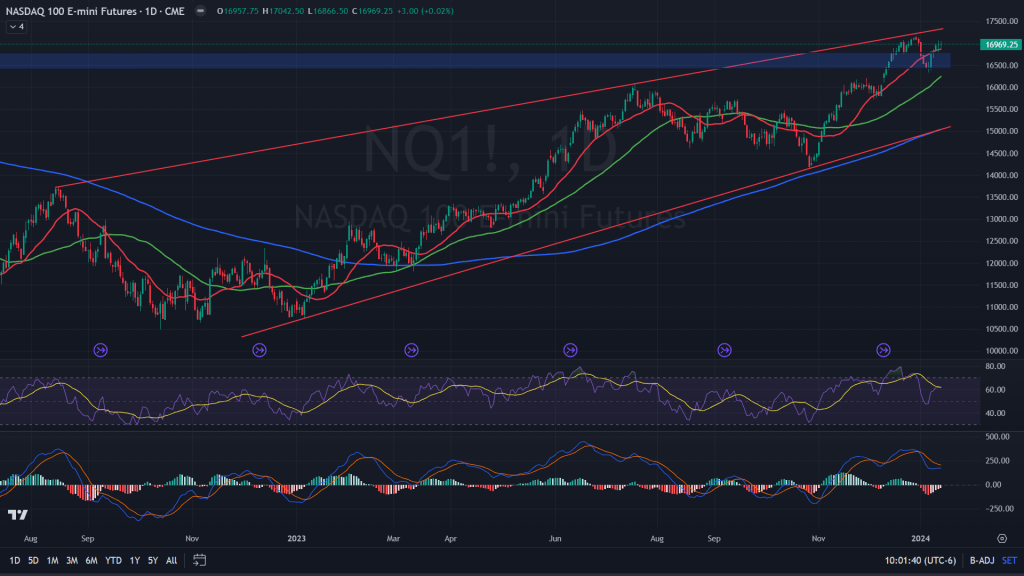
Nasdaq 100 futures (Daily candles): While there was a rising wedge on the 4H candles of the Nasdaq, there is a bigger rising wedge on the daily candles too. During that last correction while Nasdaq mean reverted the 20 MA, it also backtested the breakout above the supply zone (now demand zone) of previous all time high. Now that the supply zone has been backtested and crossed past, I would consider buying the dips with tight stops until the January opex.
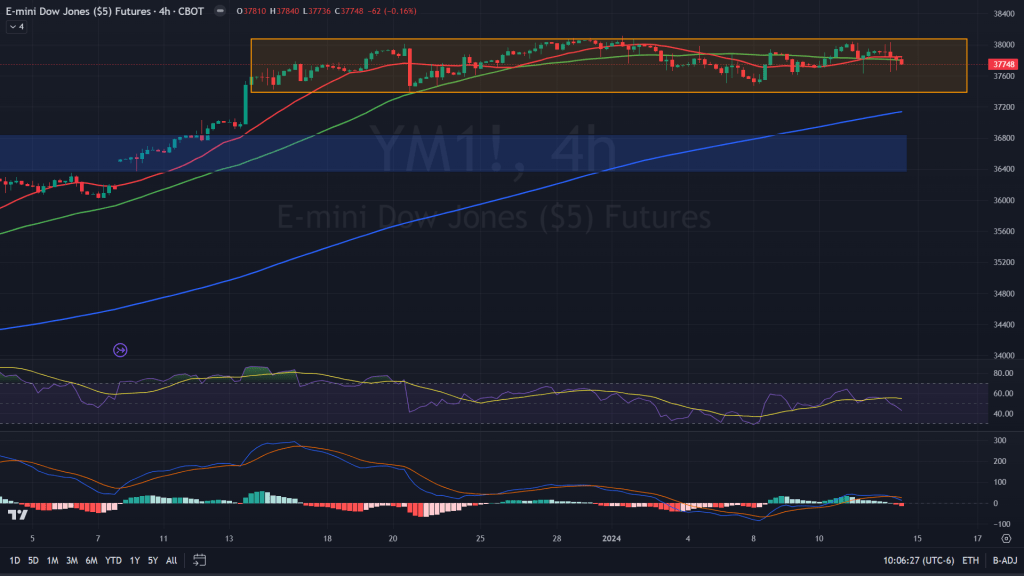
Dow Jones Industrial Average futures (4H Candles): Pretty similar except the inverse H&S, which is absent here. Consolidating within a very narrow range, above the key demand zone for almost 20 days now. Expect more of the same until Jan opex.
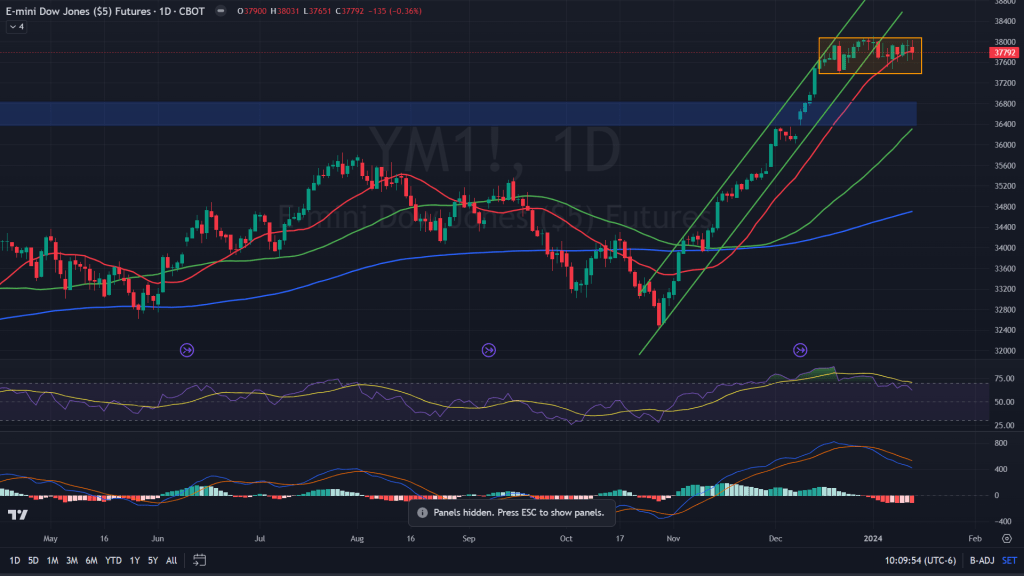
Dow Jones Industrial Average (Daily Candles): On the daily, it is more of a consolidation above 20 MA of the daily while 50 MA plays a catch up. I would guess some give away of the 20 MA after Jan opex and then the rally back up.
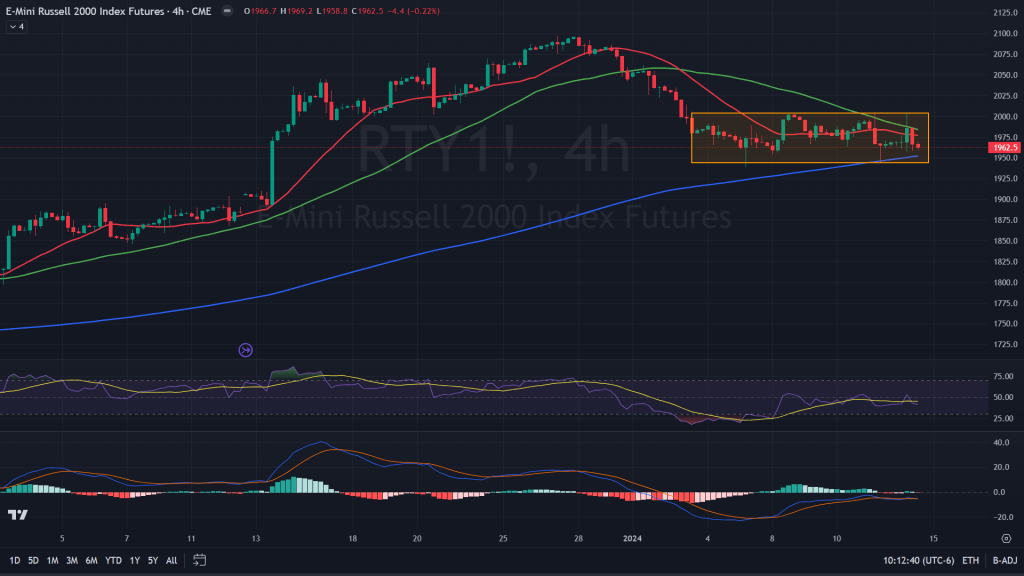
Russell 2000 Futures (4H candles): Russell 2000 has been the only index that has fallen bigger than all the other indexes and has stalled to form a low base while bulls and bears catch their breath to see what could be their next course of action.
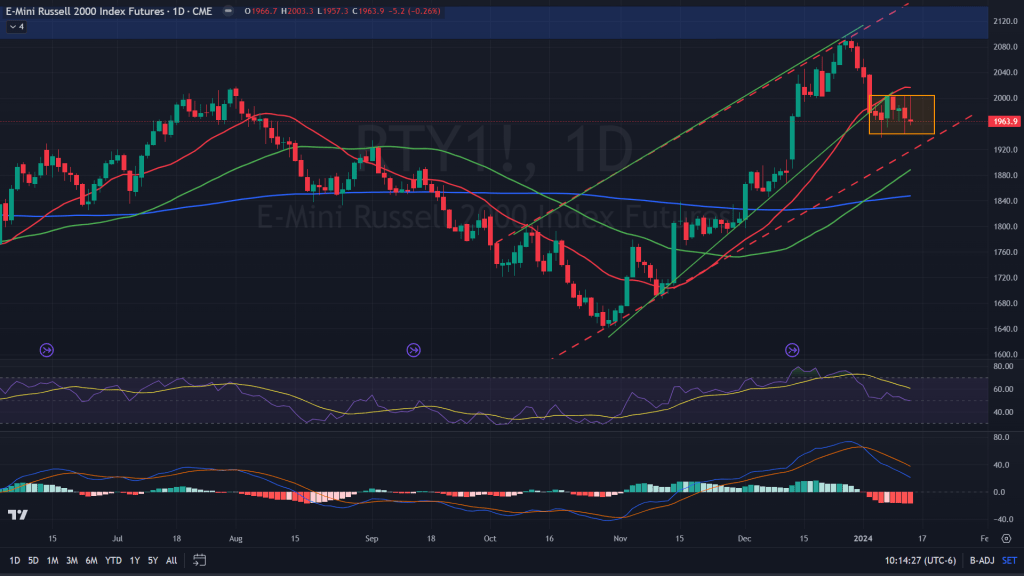
Russell 2000 Futures (Daily candles): On the daily, while it broke down of the rising wedge and 20 MA, it didn’t result into bigger falls after that. Probably indicating that this wedge is about to get converted into a channel (red dashed lines), say around 1930 and around the 50 MA that could come in around 1900-1910 while Russell consolidates within this boxed zone.
Conclusion: When markets hit 9 consecutive weeks of gains, it was assumed and expected that there would be some correction that should/would ensue. But boy, did it NOT do so! The next few days would be more driven by earnings and opex than anything else. It is more of a consolidation util markets get their direction decided probably after the Jan opex. While Nasdaq and S&P are on cusp of a breakout on the 4H candles, other two indexes are consolidating at best. We’ll see what happens after the opex and market reacts more to the earnings.

Leave a comment