Today we’ll start our process with small cap index, Russell 2000, followed by Dow Jones Industrial and there is a reason why I’m doing this way. Just follow along:
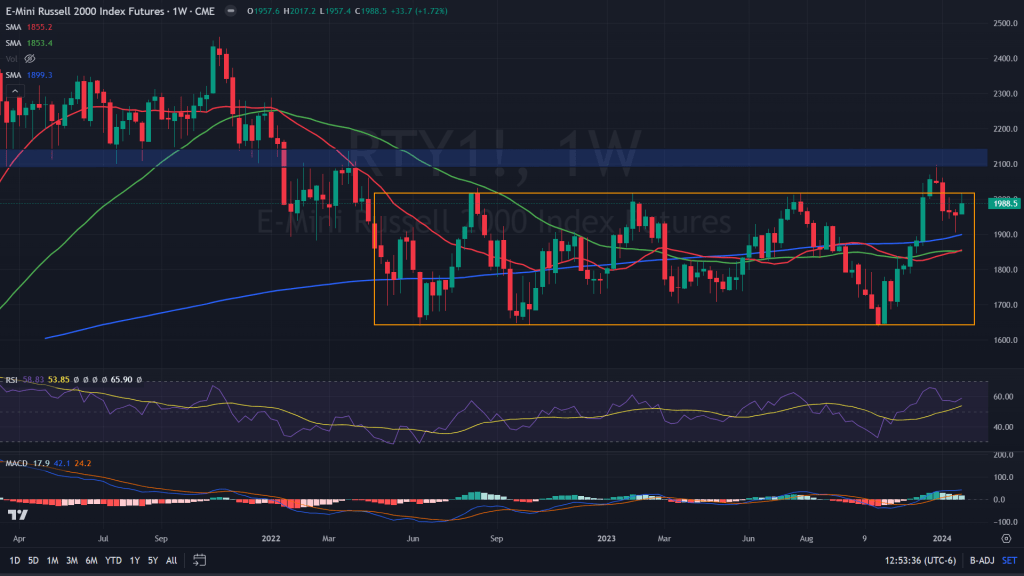
Russell 2000 Index futures (Weekly candles): When markets started this rally last year, small caps, especially the Russell 2000 index was lagging far behind to start the rally. When it did, it rallied in a jiffy to play the catch up. So much so that it broke out of the long held consolidation zone (orange box) in less than a week’s time. Only come back down after it faced resistance from the supply zone of 2100s just above the boxed zone. Since then, Russell has been lagging behind and one has been wondering if this overall rally is done with? May be if we take a closer look on the daily chart, we might get some clues.
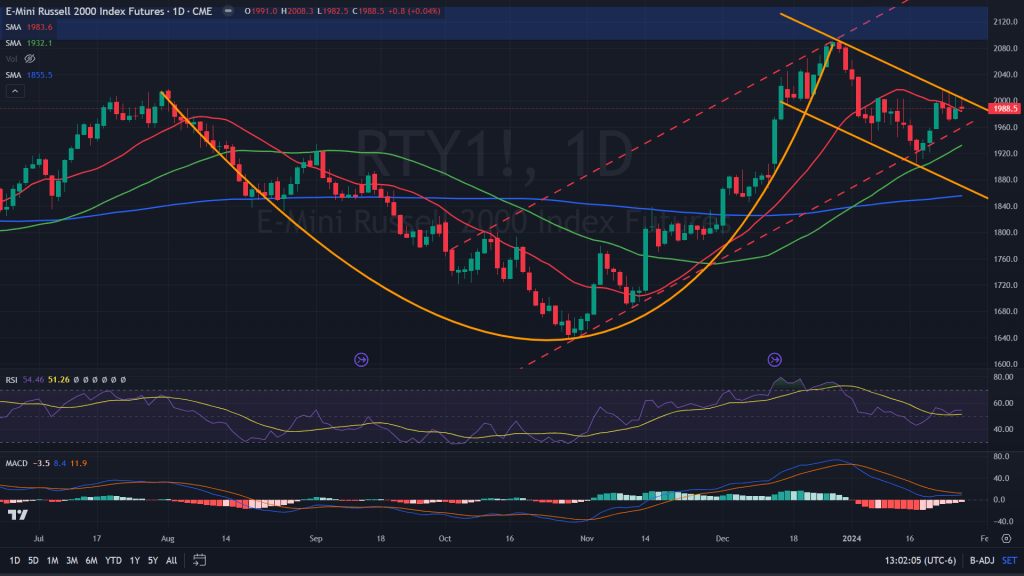
Russell 2000 Index (Daily candles): Sometimes one of the great set-ups to trade are lying plain in sight, we just have to look at things from the right perspective. While yes, Russell did find resistance in the form of that supply zone right around 2100, it hasn’t fallen deep into the mess and has only been forming a bull flag right underneath. If that wasn’t enough, this bull flag is right after it formed a beautiful cup for a few months of 2023. We have seen what Cup and Handle does to the prices when it breaks out, few weeks ago, S&P and Nasdaq both broke out of that C&H an ever since all we have seen is the rally that has no big correction. I don’t know if Russell would do the same, but certainly has all the potential to do so.
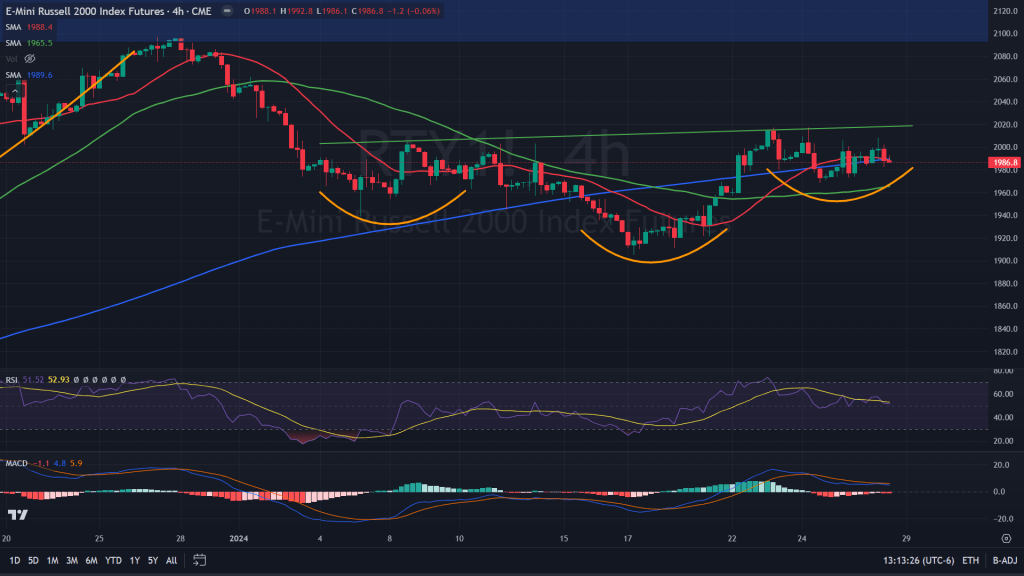
Russell 2000 Index future (4H candles):
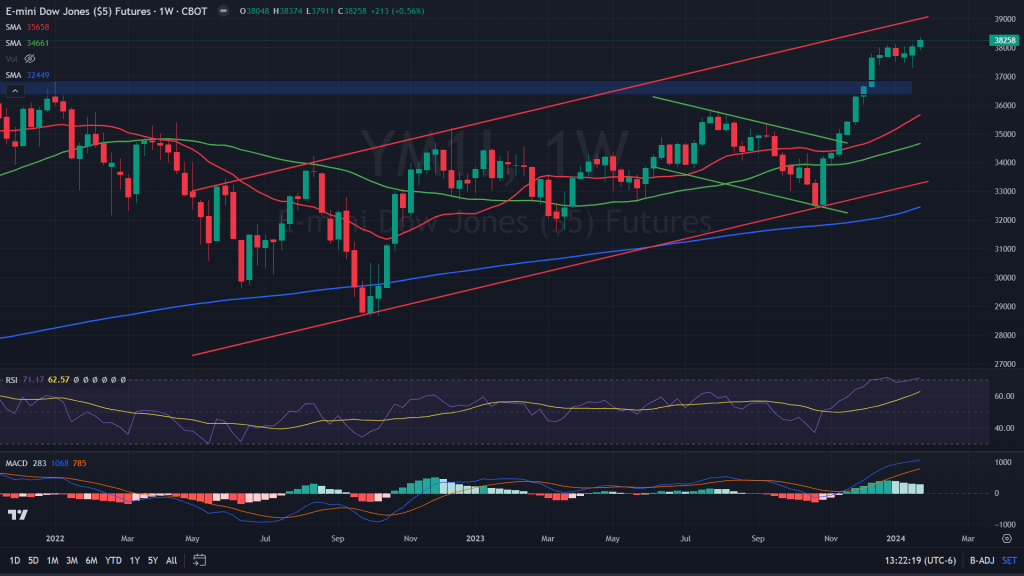
Dow Jones Industrial Average (Weekly candles): While Dow Jones had a vertical rally that took it all the way up and beyond previous all time high, it has been consolidating just above that previous high of 2021/22. That says it has some more room to go before a bigger, better (and perhaps healthier) correction.
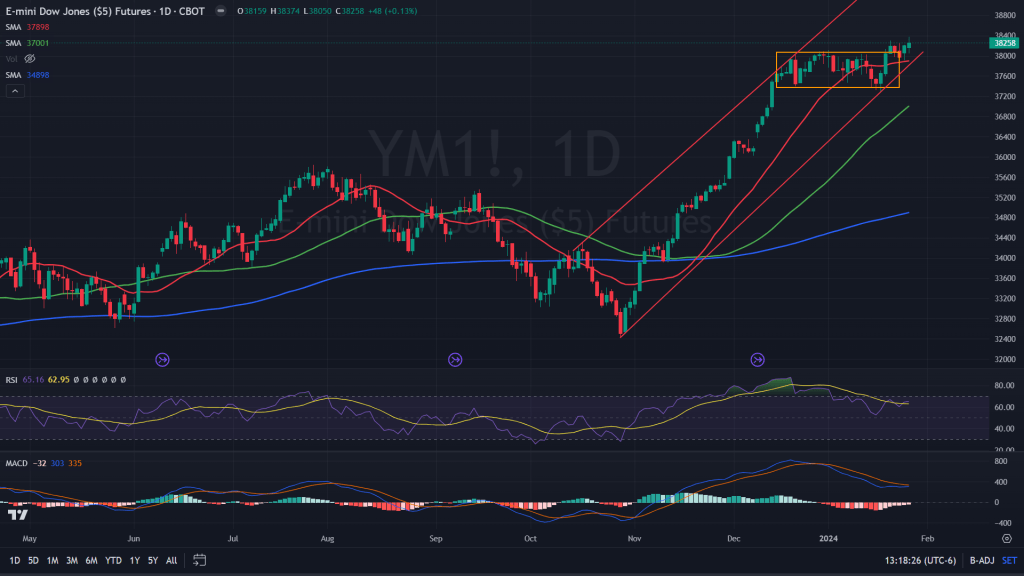
Dow Jones Industrial Average (Daily candles): The daily candles of the Industrial index was consolidating for quite some time and had a breakout moment later in the previous week, backtested the same and has resumed its uptrend again. Expect this rally to continue in the coming week.
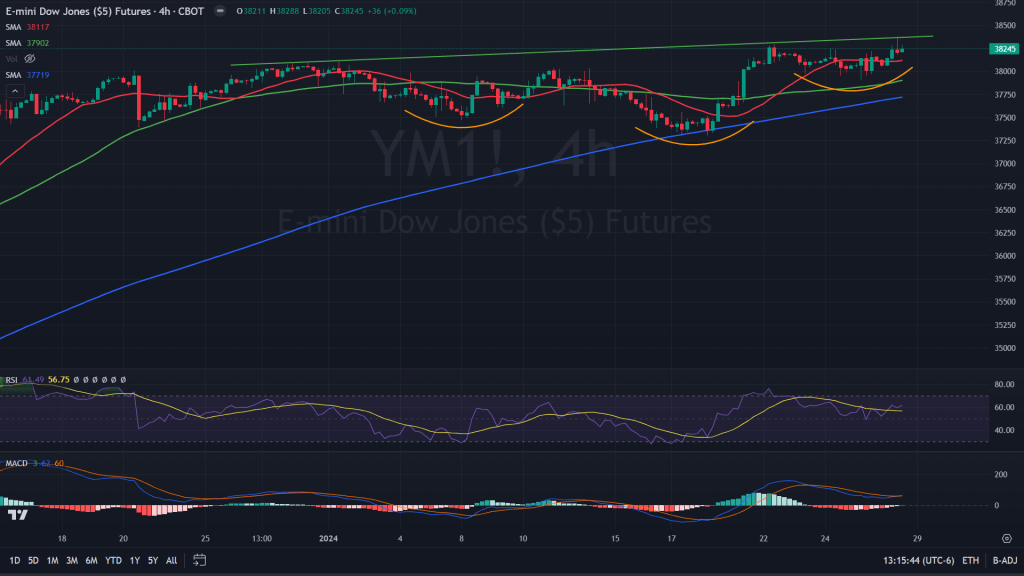
Dow Jones Industrial Average (4H candles): If that wasn’t enough, 4H has another good news for us – Inverse Head & Shoulders looking for a breakout. Probably Sunday evening when futures open up we would have something green to see and cheer about. If not Sunday, most likely be early part of next week.
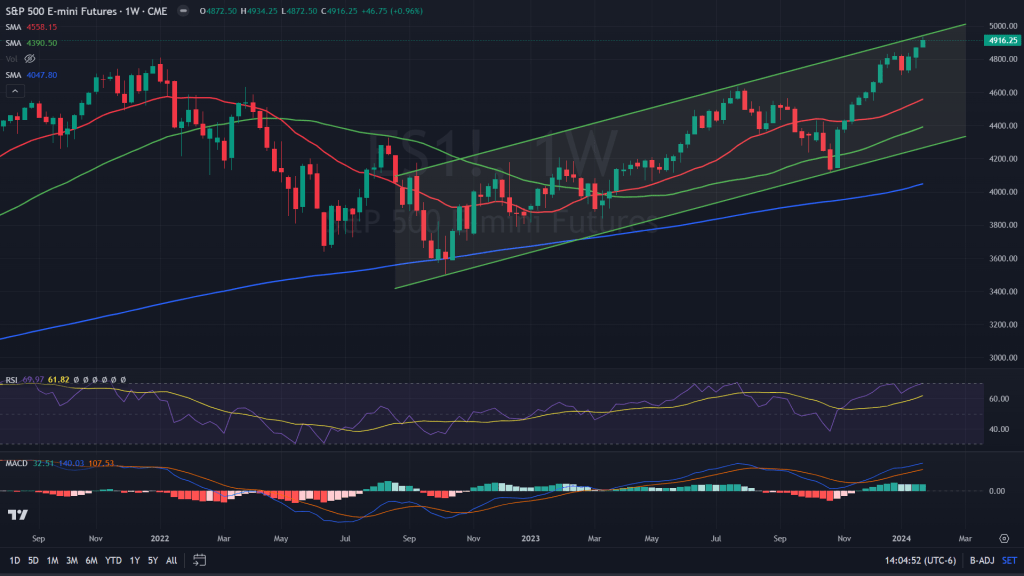
S&P 500 futures (Weekly candles): V-shape rally at best! Since the end of October all we have seen the market doing is rally, pause and rally again, in the process continuing to push the boundaries of this green channel.
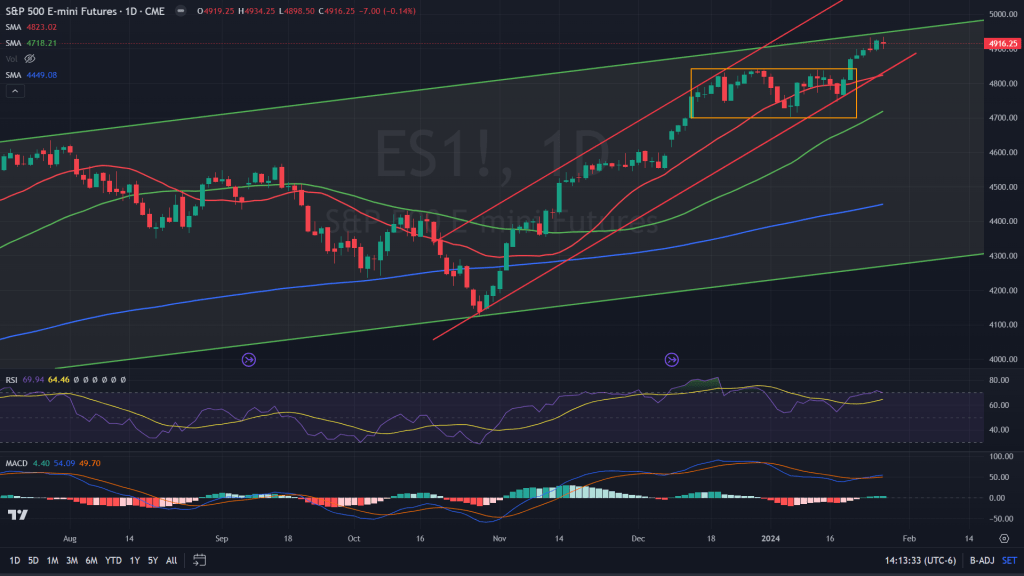
S&P 500 futures (Daily candles): Breakout and resistance and then pause and then rally again. Thats what is the story of S&P has been all through this journey up north. Currently stuck around upper end of the green channel, after breaking out of the boxed zone. Expect some consolidation/minor correction again before rallying again.
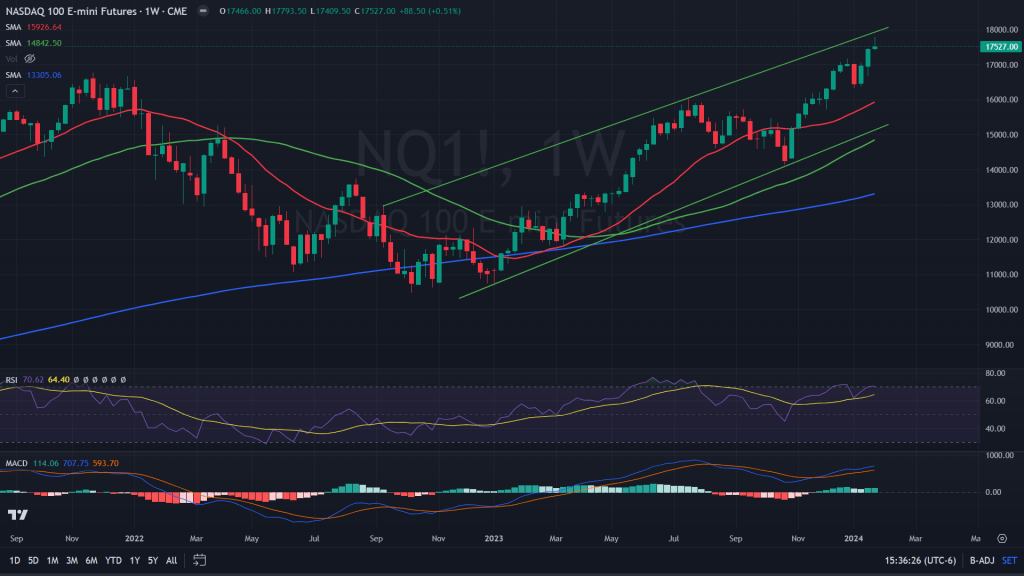
Nasdaq 100 Futures (Weekly candles): As always the story of Nasdaq is the same as that of the S&P; rally, pause and rally again. Although the candle of last week doesn’t give any heathy sign – shooting star at the top and at resistances. Expect some seling pressure based on the weekly candles.
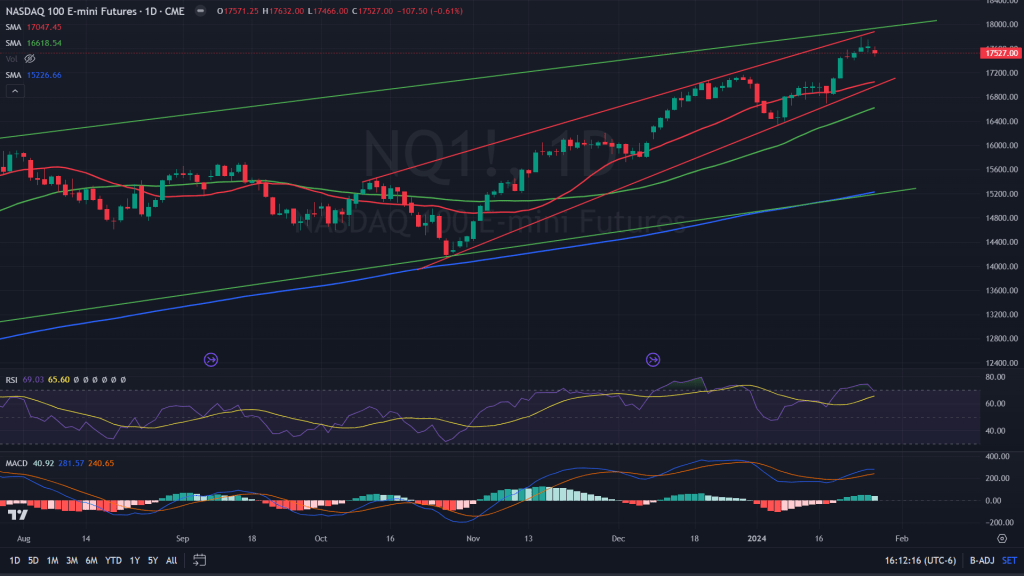
Nasdaq 100 future (Daily candles): While the weekly faced resistance of the channel, daily candles faced it from upper end of the wedge. Expect some more selling and probably some support around 17,100 before bills try and revive it back up.
Conclusion: Quite an interesting week the next would be! While small caps didn’t participate in the recent past and just about to, we have Nasdaq and S&P showing signs of some weakness. Selective buying is what is needed going ahead as against “rising tide raises all boats”.

Leave a comment