Last week we saw indexes marking yet another week of new highs, especially with the SPX cash market closing the week above 5000 for the first time. With that said, how far is this rally going to last and what all should we look forward to in a week that has CPI and PPI lined up as key data points. Lets dive in:
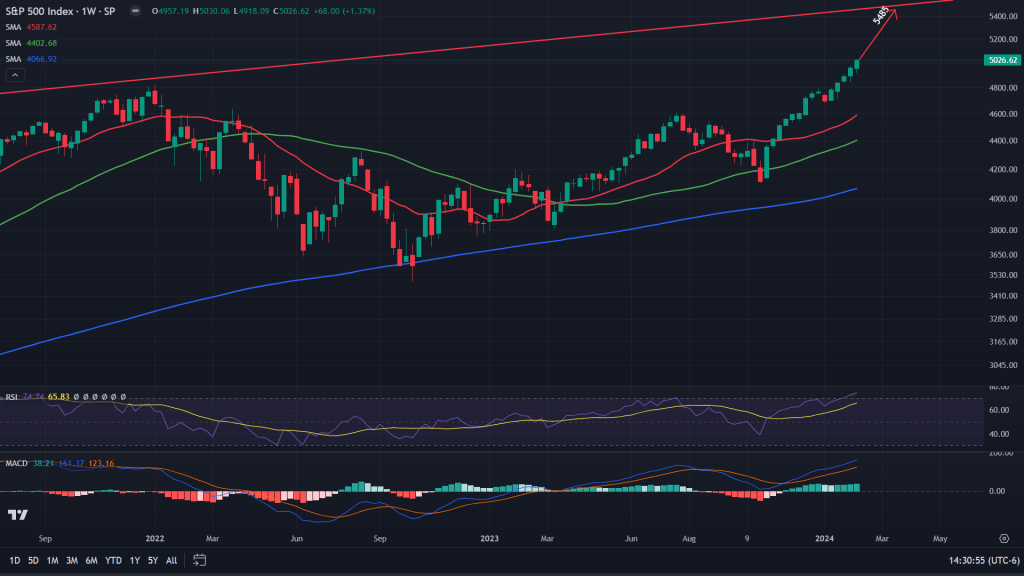
SPX weekly candles: Before we take a deep dive into the key index futures, lets take a look at the SPX cash charts. I had mentioned about this 100-year long channel that has been forming on SPX in the year ahead outlook post (original post here). It looks like SPX wants to close in on that 100-years long channel resistance before taking a breather. Where does that resistance lie? If markets continue to rally the way it has for the past few weeks, then probably 5485 is where it should find its key resistance.
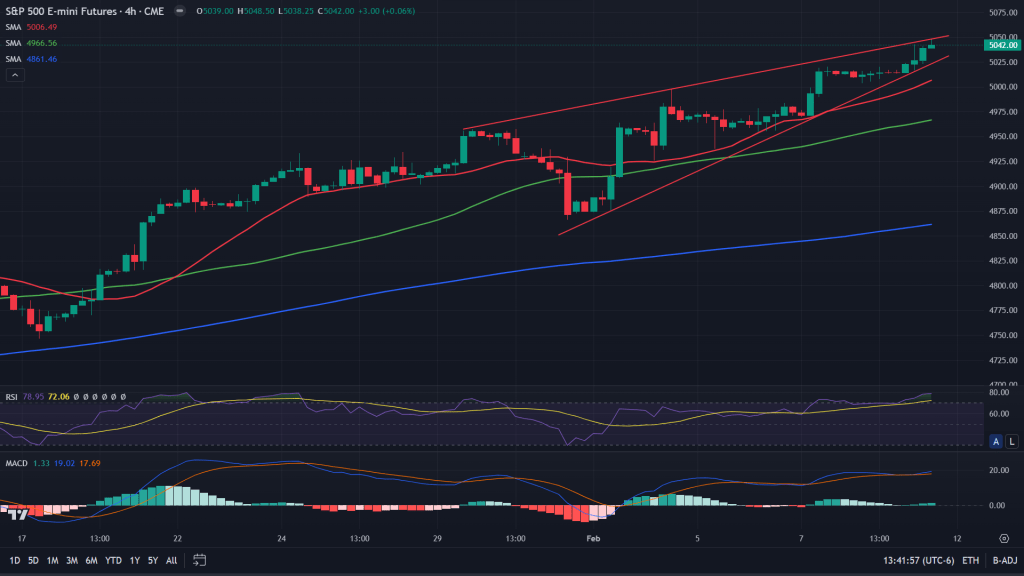
S&P 500 futures (4H candles): Moving back to the futures chart of the S&P 500 E-mini, 4H candles are forming a rising wedge that seems to be showing signs of exhaustion. Although we have seen in this rally so far, none of those wedges and channel breakdowns really resulted into any sharp falls. So even if this 4H rising wedge breaks down off this rising wedge, it may not result into a sharper fall just yet. 5010/15 could be the first step of that breakdown and 4980 would be the next.
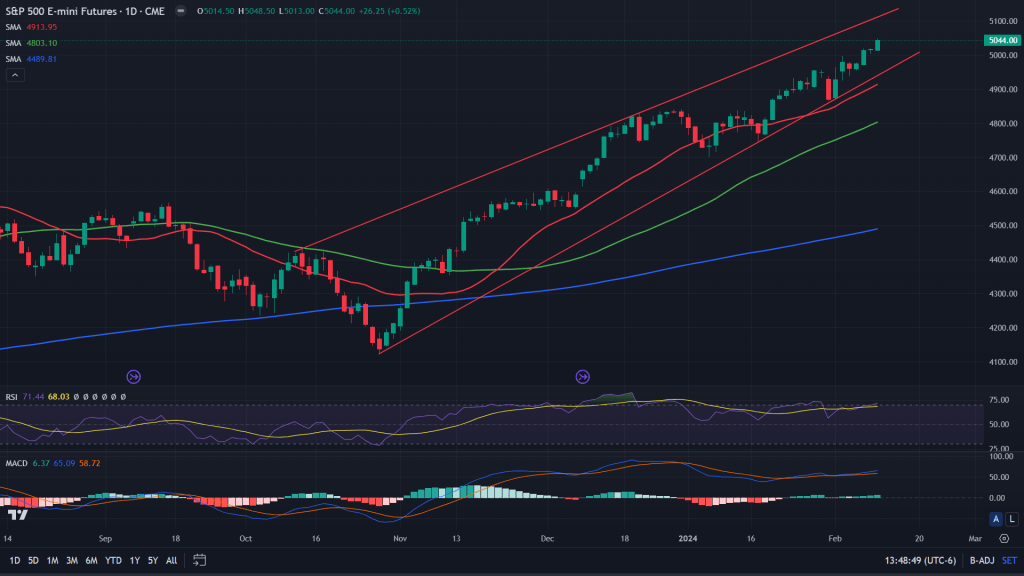
S&P 500 futures (Daily candles): Daily candles too are showing this rising wedge, which is far from breaking down yet. But just in case 4H candles do give some phillip to the bears, then 4960-80 is where it would break down. Not before that.
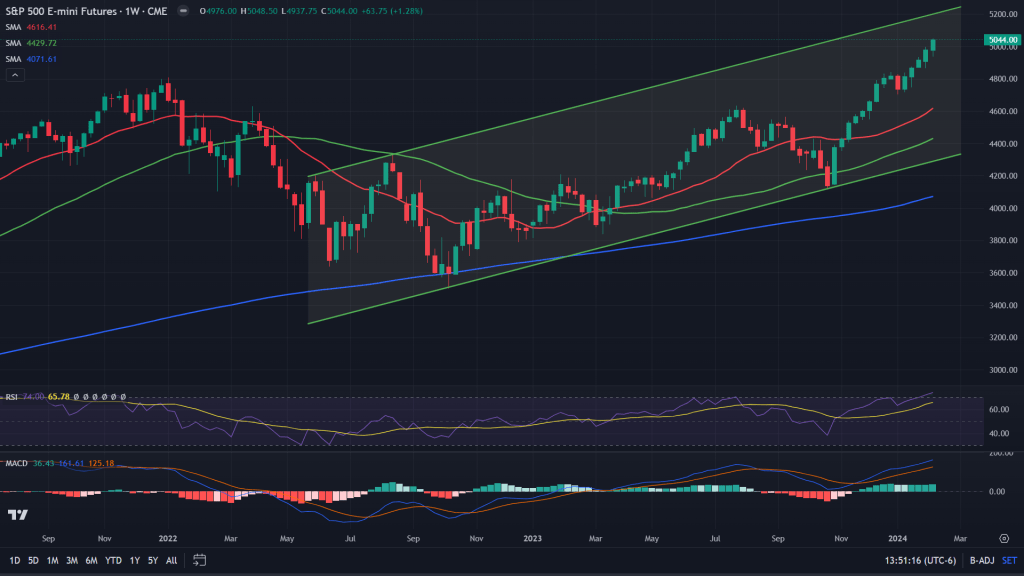
S&P 500 futures (weekly candles): When we zoom out a bit further to the weekly candles of the S&P futures, it still has a lot of room to go on the upside towards upper end of this rising channel. 5210/5245 is where this channel resistance could come into play.
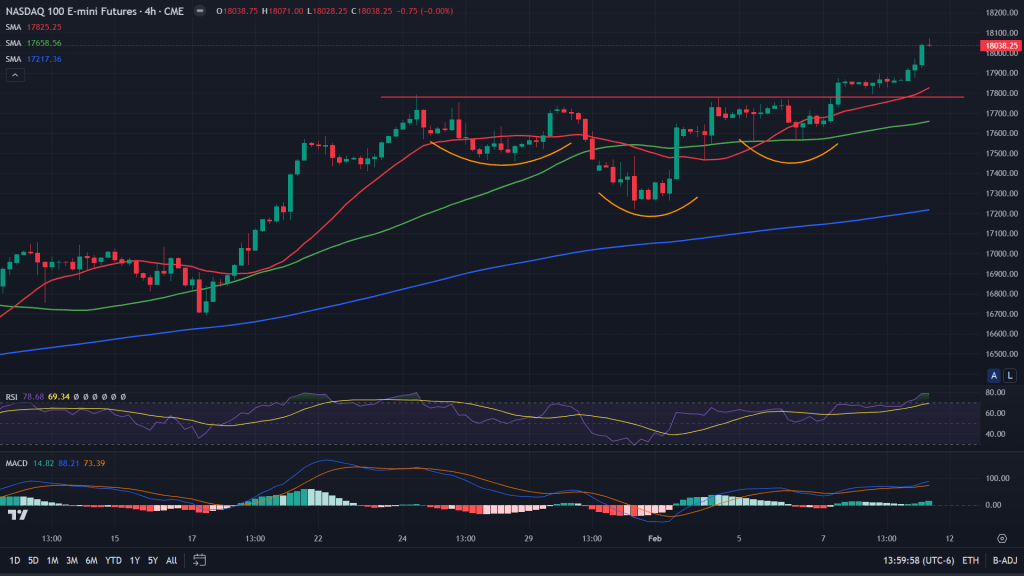
Nasdaq 100 futures (4H candles): Last week Nasdaq 100 broke out of this inverse H&S and rallied to new high. This breakout is yet to be backtested. Probably next week we could see that backtest coming into play. 17780/800 is where the backtest support lies.
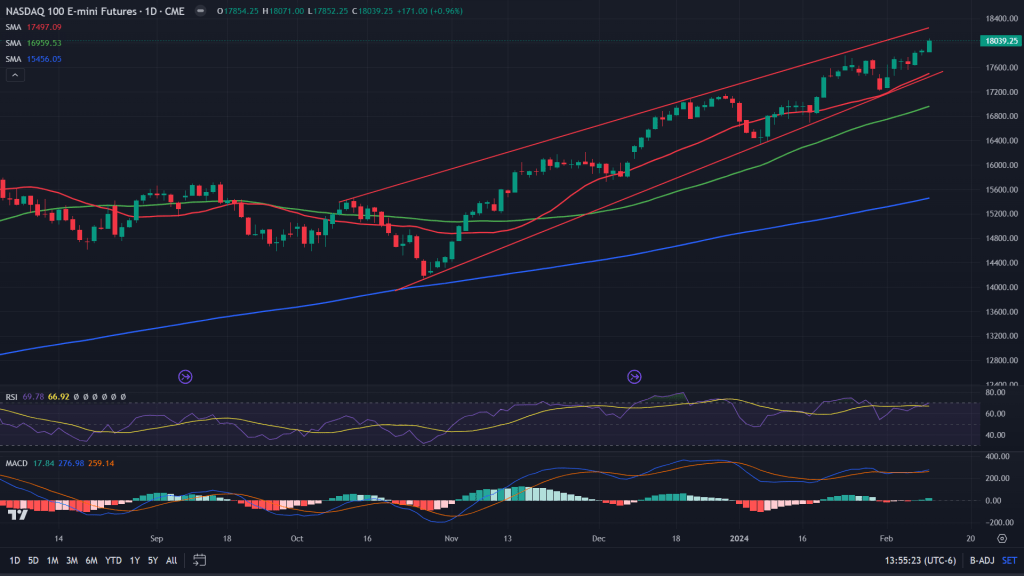
Nasdaq 100 futures (Daily candles): On the daily candles, this rising wedge is closing in on the top out, for now. In case next week shows any sign of weekness with the monthly opex (on 14th) and CPI, PPI due too, the only place where Nasdaq 100 futures would breakdown is 17460. Until then, bulls are safe.
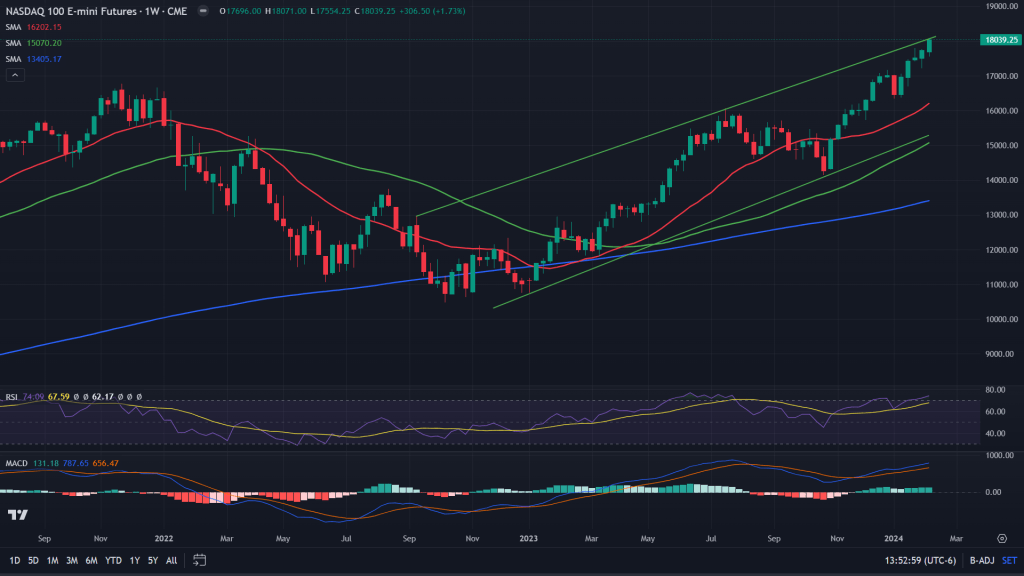
Nasdaq 100 futures (weekly candles): When we zoom out further, the weekly candles does show the price has almost reached a key trendline resistance of this rising wedge of the weekly. Remains to be seen how it reacts here in the coming week.
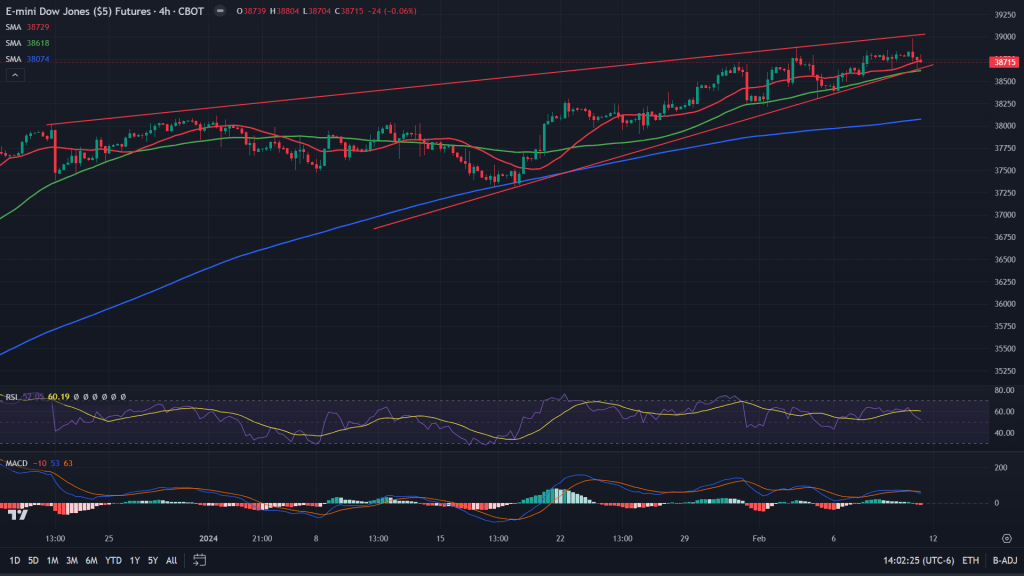
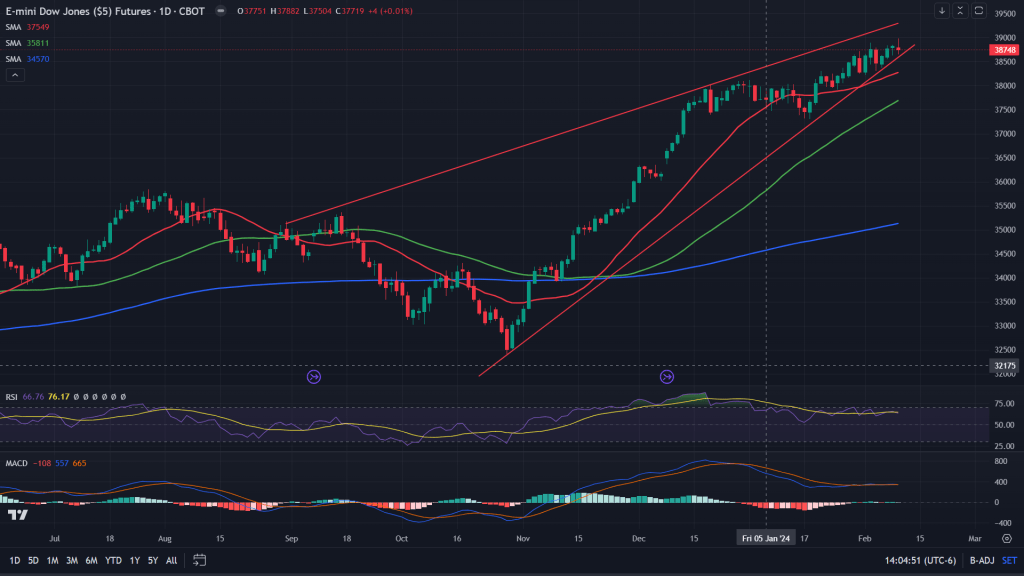
Dow Jones Industrial Average (4H candles): Dow Jones Industrial Average has been a laggard this year and whatever small rally it has seen, was constricted within this rising wedge as seen in the charts below. 4H chart rising wedge is on the verge of breaking down. If it does break down earlier in the week itself, 38260 would be the key support area to look forward to.
Dow Jones Industrial Average (Daily Candles): Even the daily candles are showing signs of topping out with yet another rising wedge while the daily candle on Friday closed with evening star formation.
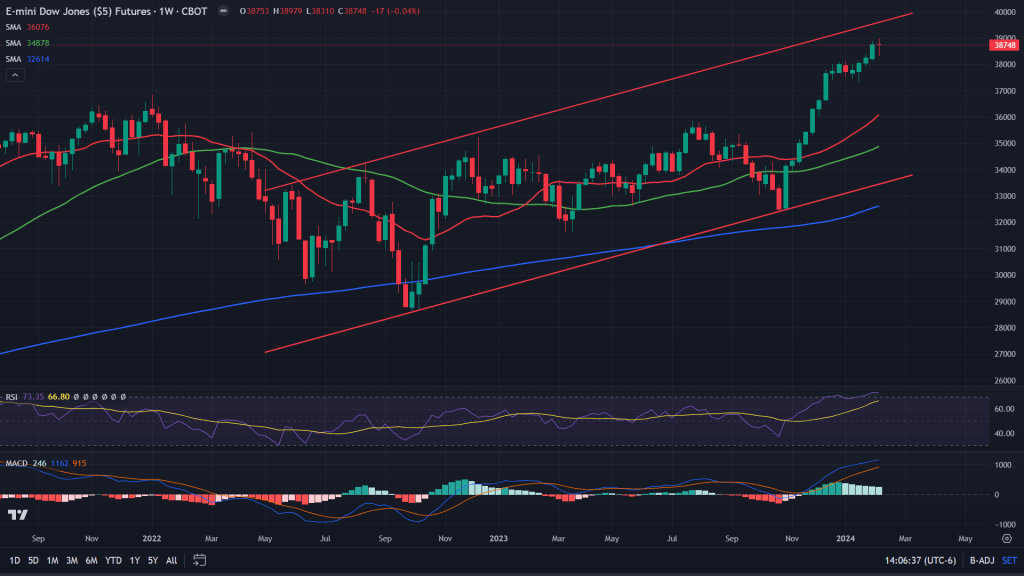
Dow Jones Industrial Average (Weekly candles): Zooming out further, weekly candles do not show any great signs of topping out yet. All it has got is a doji to close last week at. We have a leg up pending on Dow Jones Industrial Average too.
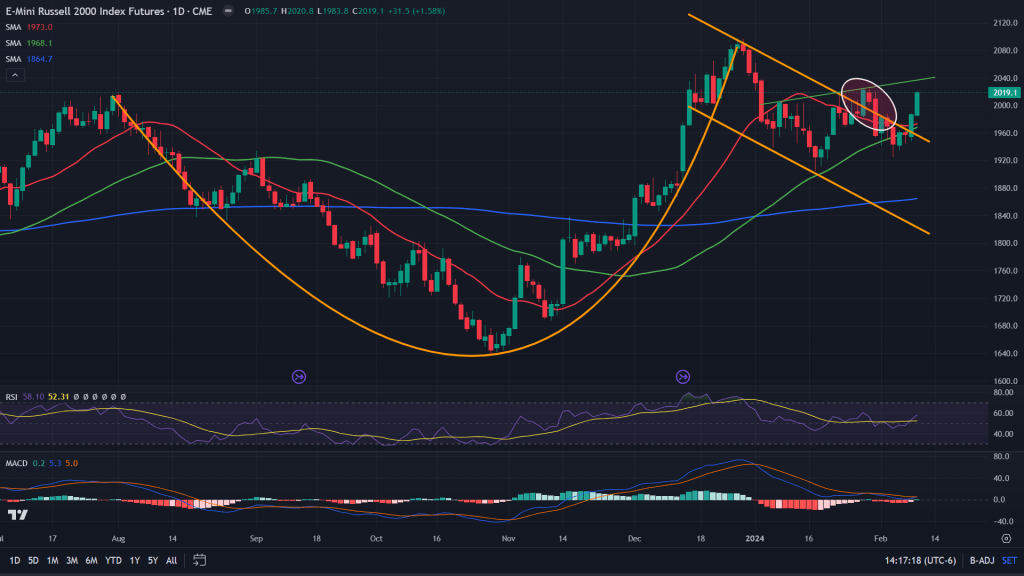
Russell 2000 Small Cap Index futures (Daily candles): The small cap index future gave a failed breakout last week, only to result into a breakout yet again. This time it looks much more promising to sustain. Two consecutive days of big green candles, 20 and 50 MAs are behind the price and channel (bull flag) resistance crossed past too. There still lies a small resistance around 2025-40 zone (green line). If last 2 days of price action is any clue, then expect this resistance to cross past too in the next 1-2 weeks itself. Once it does, then bulls can look for quote bigger rally ensuing in the small cap index future.
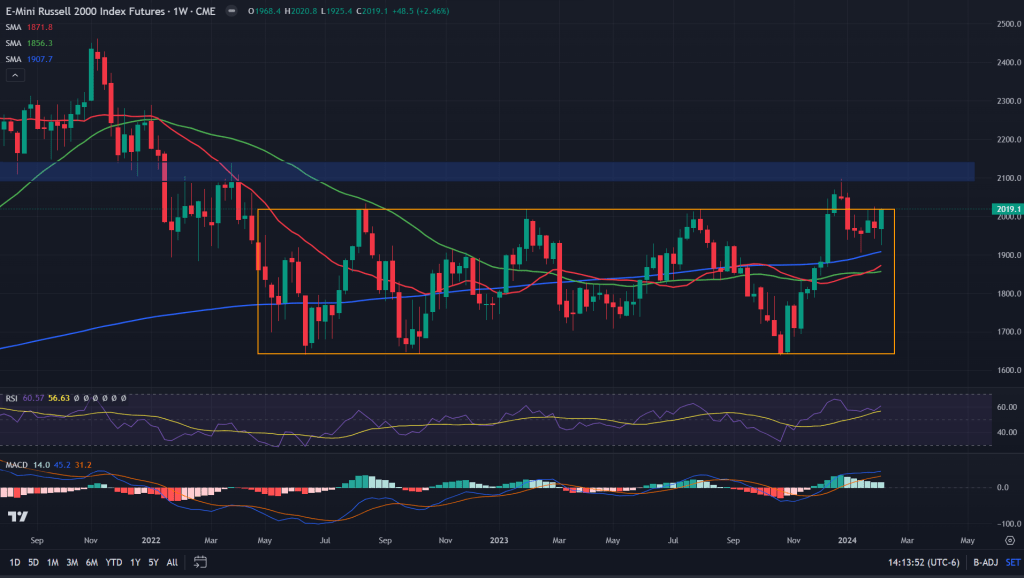
Russell 2000 Small Cap Index futures (weekly candles): At the start of this year, when Russell 2000 gave us a failed breakout, it could have gone down further. But it didn’t. It didn’t even fall past the 20, 50 and 200 weeks MAs. In fact all of the past few weeks of this year, the price has been consolidating above 200 weeks MA and that’s a very healthy sign for the bulls. Expect fireworks in small cap stocks in the coming few weeks if next week’s key data point and the opex support.
Conclusion: While next week looks more of a break from the rally of the past few weeks, in no way does it look as if the price action would be anything for bears to get excited about. At best, there would be some small dips that could easily get bought into. Small caps have a huge rally up their arms in the weeks ahead.

Leave a comment