Last week was wild and volatile in a long time. Many started assuming/believing and calling it as THE top in place. But is it really the top yet, especially when we saw what happened with SMCI after it posted one of the most overbought RSI on almost all time frames? We don’t know yet IF the top is in and IF the AI mania is on the cusp of topping out, but we can definitely try and decipher what markets are trying to show. Also, last week I had posted one tweet that’s important to note her:
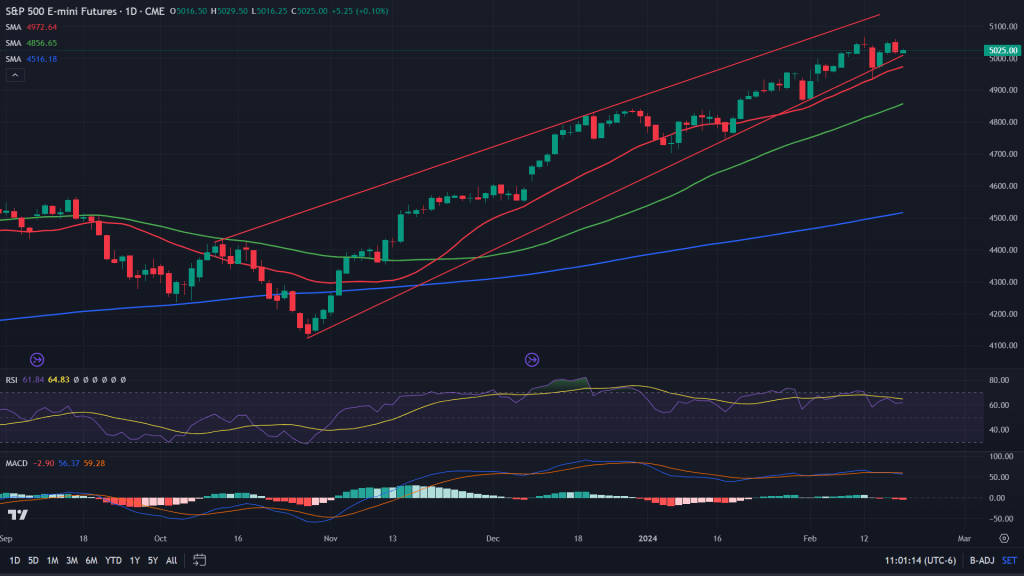
S&P 500 futures (Daily candles): S&P is on the verge of breaking down off this rising wedge, right under which lies 20 days MA that had provided a good bounce after the CPI mini-crash last week. Would this time be any different? We would know within a day or two. Aiding the bears is negatively diverged RSI and MACD.
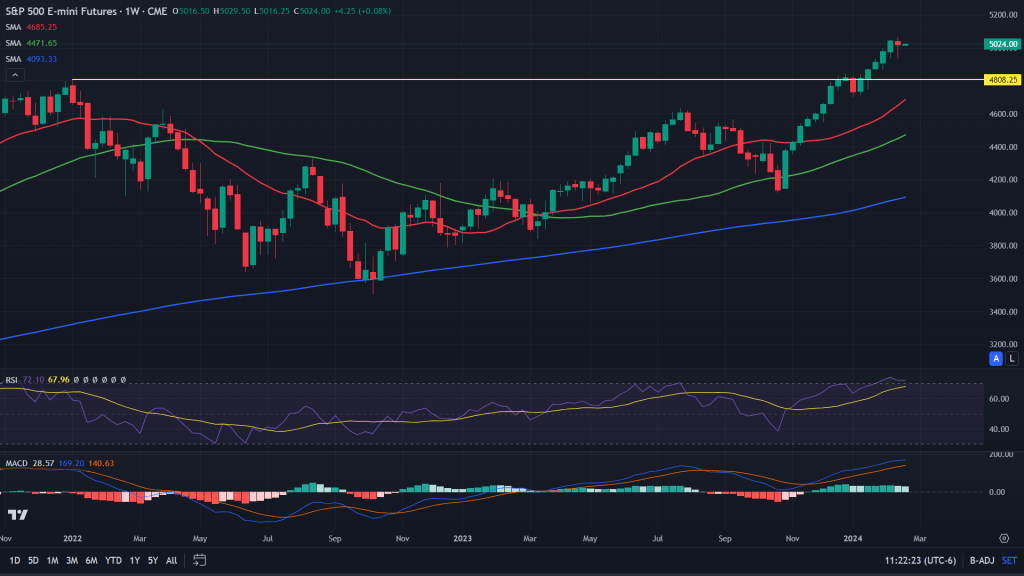
S&P 500 futures (weekly candles): A quick look at the weekly candles, show us that due to market’s non-stop rally, there hasn’t been any meaningful pullback or a backtest of any of the breakouts. It would only be reasonable for markets to show some backtest of the previously held all time high, which is 4808.25.
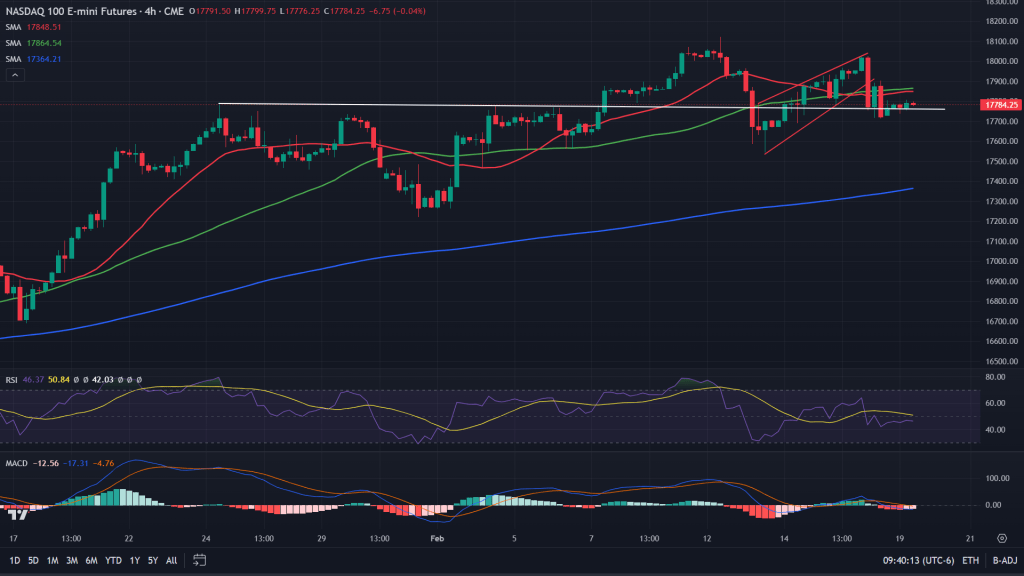
Nasdaq 100 (4H candles): While on 4H candles, Nasdaq did a bear flag breakdown on Friday, it is still around the critical support area of the previous resistance (white line). But given the consistent attack by the bears, the support looks weak now.
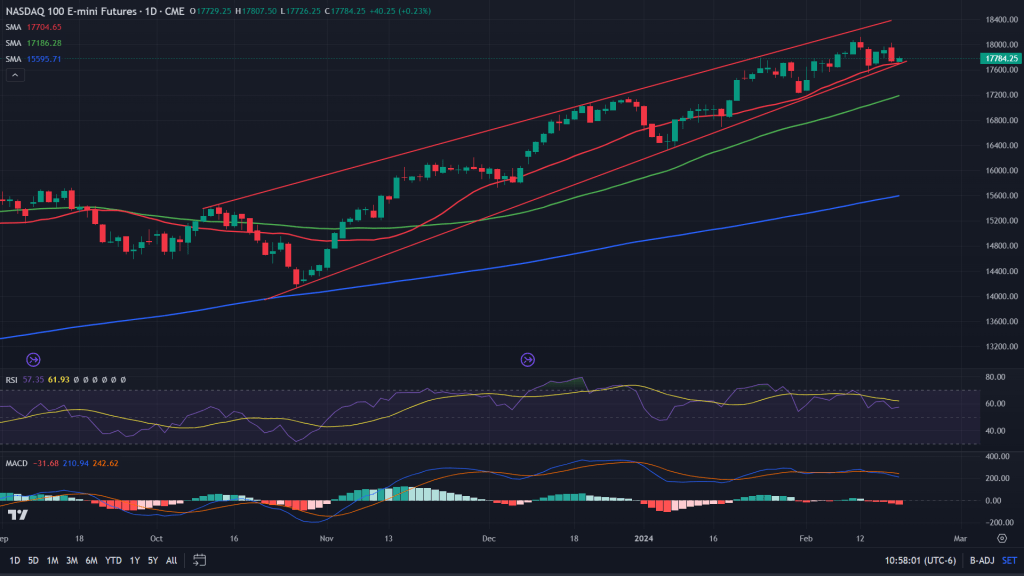
Nasdaq 100 (Daily candles): Even on the daily candles, the price is hanging just by a thread on the verge of breaking down off this rising wedge and 20 days MA. About time perhaps?
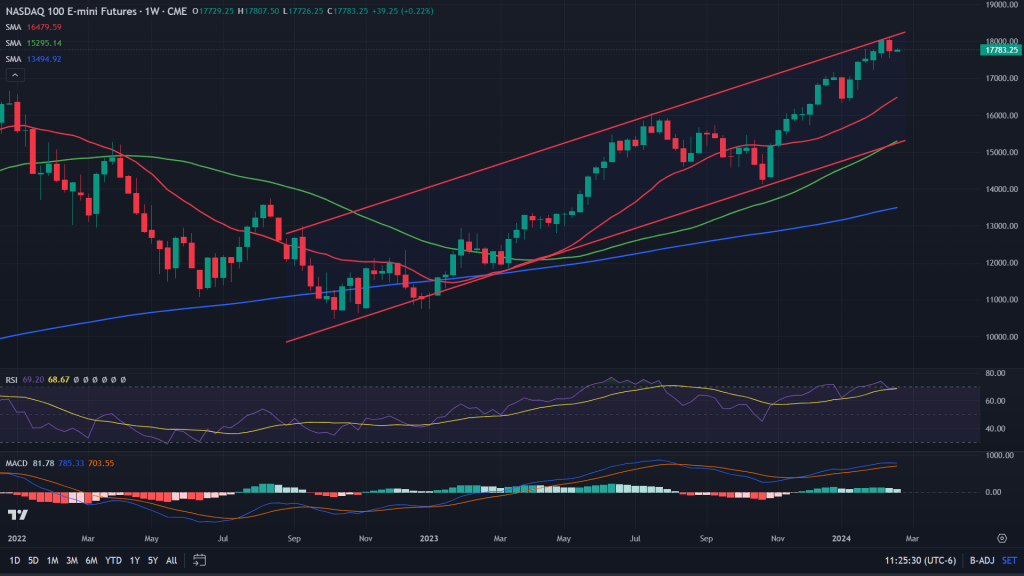
Nasdaq 100 (weekly candles): On the weekly candles, the price has reacted exactly from the upper end of this channel. Expect an attempt to backtest previous all time high based on the weekly candles too, which is at 16767.
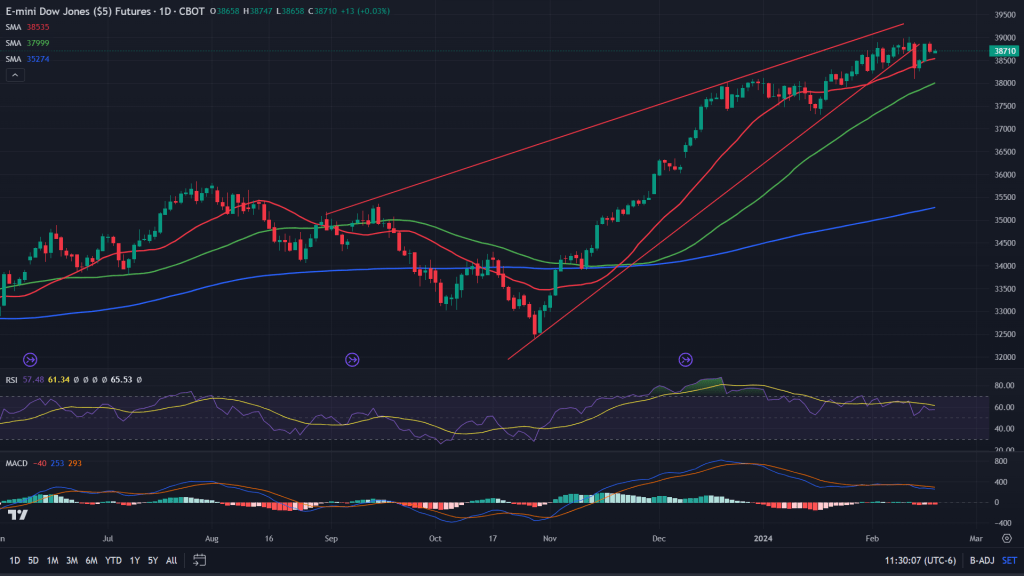
Dow Jones Industrial Average (Daily candles): While S&P and Nasdaq have not yet broken down, Dow Jones has not only broken down, but has also backtested the breakdown. It has been a weak link during past few weeks as it industrial stocks have not participated in the rally as much as others have.
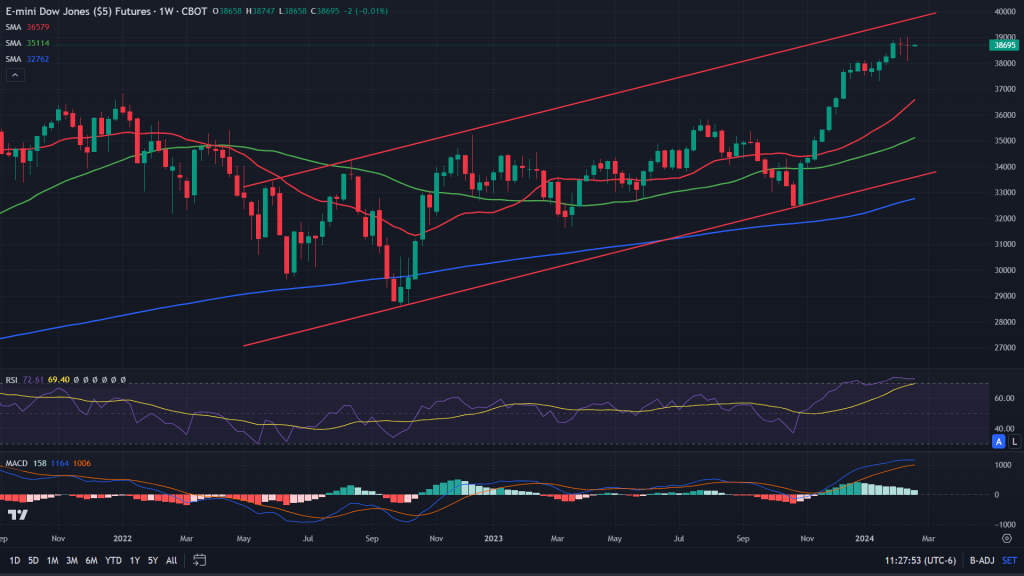
Dow Jones Industrial Average (Weekly candles): On the weekly candles, it has formed two back to back doji candles at all time highs. A doji candle shows indecisiveness of the bulls as well as bears and usually results into change in trend at the tops. Certainly not a healthy sign for the bulls.
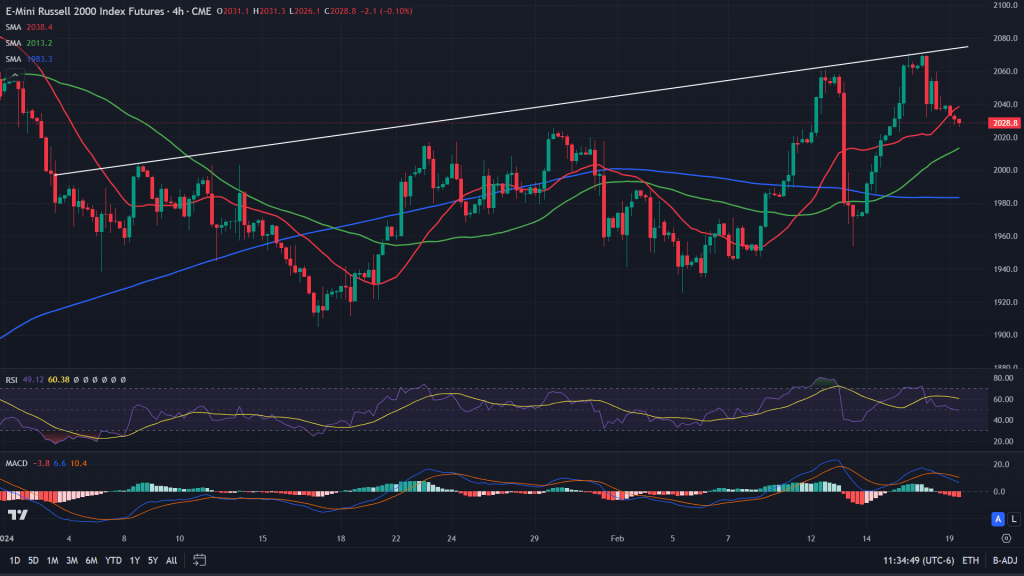
Russell 2000 small cap Index future (4H candles): While after CPI every key index fell, Russell 2000 index was the only index that rose back up and beyond recent high. Thats a healthy sign. BUT, not enough to cross past the resistance that has been a tough nut to crack in the recent past.
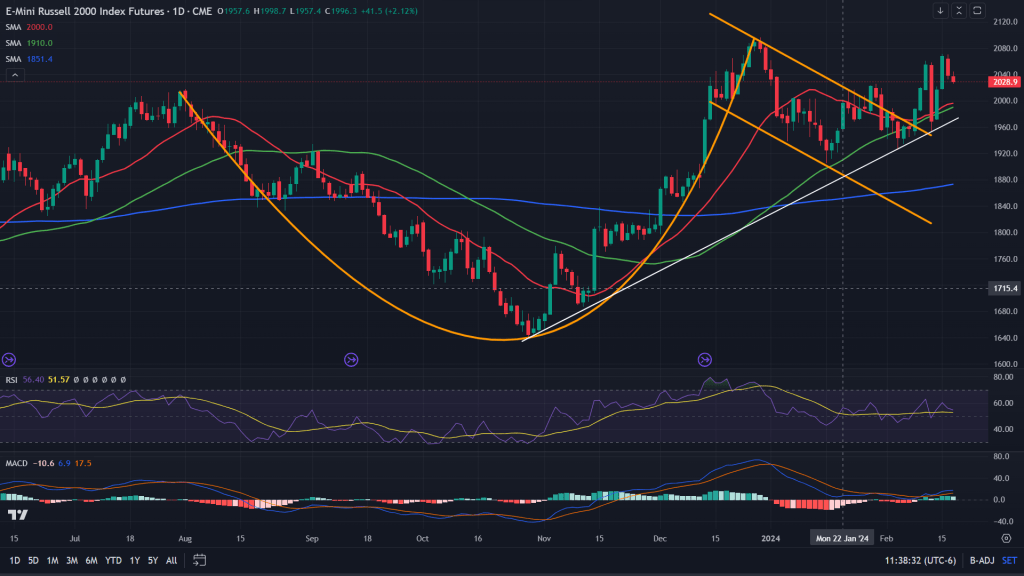
Russell 2000 small cap Index future (Daily candles): When we zoom out, we get the rationale for the bounce – it was a backtest of the big C&H breakout we spoke about last week. Even as thats a positive sign, it is important for the bulls to hold on to these levels in the coming week and try and cross past the resistance around 2070-90.
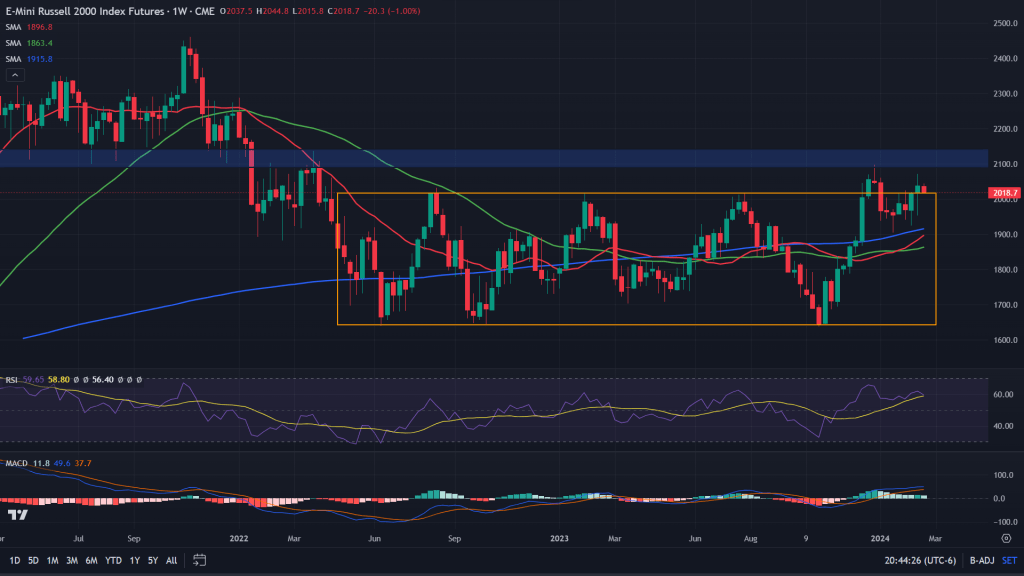
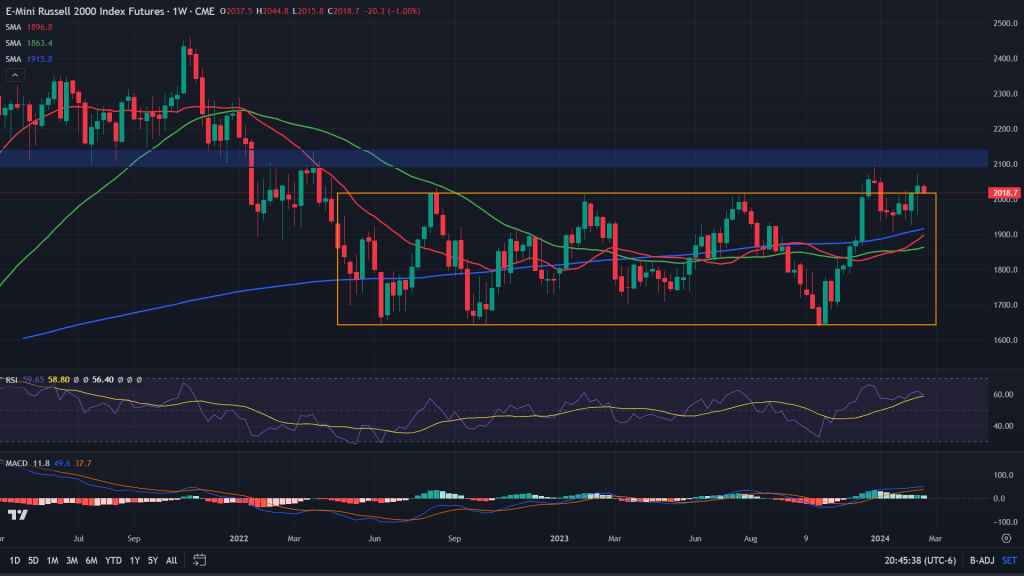
Russell 2000 small cap Index future (Weekly candles): Zoom out further and we find that the bulls are still not out of danger. The price, while out of that orange box, yet below that greyed supply zone. No wonder bulls have been finding it difficult to continue the rally even after key breakouts on the daily as well as weekly. Hammer formation of last week’s candle does give a positive sign for the bulls, next couple of weeks would be key for the for them to try and test their strength.
Conclusion: We’re in a very critical juncture of the market formation in the coming week as bulls try and broaden this rally with small caps’ participation and bears trying to gain a strong hold on the key larger indexes – S&P, Nasdaq and Dow. While I would still prefer buying selectively, yet I would be cautious of my long positions as markets decide their next course of action. Especially when one of the key flag bearers of this rally, Nvidia, would be reporting its earnings on Wednesday.

Leave a comment