Bears have been on look for a day like Friday wherein markets were up for the first half and then continued to sell-off and stayed lower for the rest of the day. What happened on Friday shouldn’t be a surprise to the bulls, especially such a long, vertical rally of the last 19 weeks, wherein all we got was only 3 weeks of red candles, including the last wee. So any pullback that would last for a few days, would be a healthy and welcome one. But is it only a few day’s correction we are looking for now? Let’s try and find out.
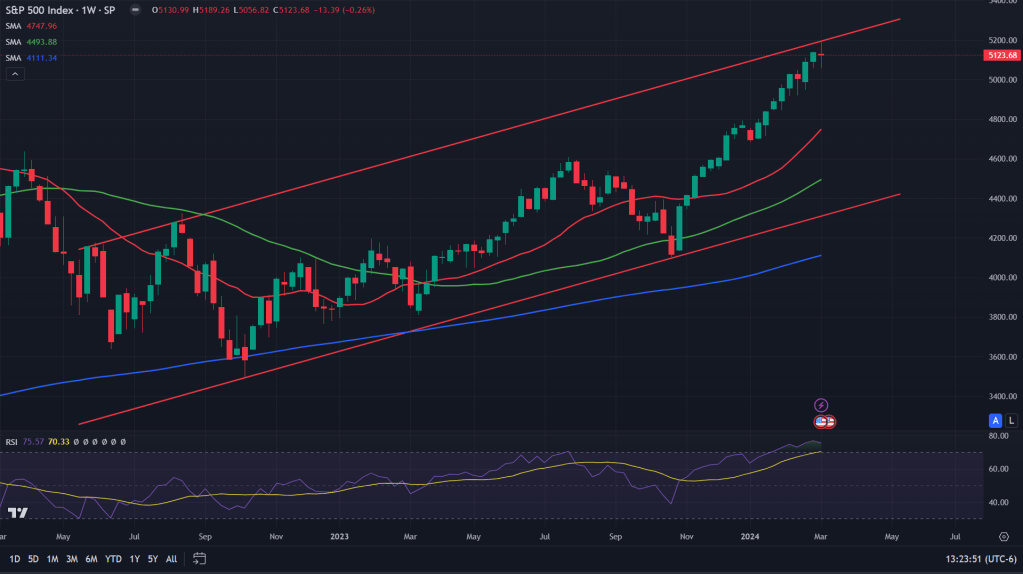
S&P 500 spot index- SPX (weekly candles): SPX reacted from upper end of this channel that has been holding for almost a year now. What is interesting is that Friday’s sell-off from top has resulted in the weekly candle being a doji – an indecisive candle. A doji at all time high and channel resistance is a red flag for bulls and they must be careful holding their longs at this point.
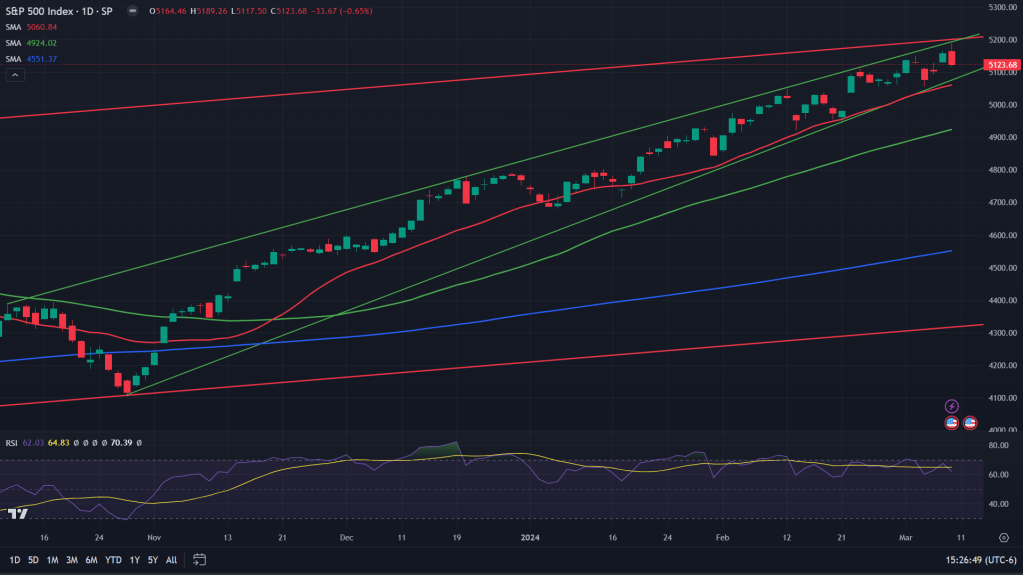
S&P 500 spot index – SPX (daily candles): When we zoom in a bit, daily candles of the SPX points few more red flags – bearish engulfing candle on the daily, rejected off the upper end of this rising wedge, coupled with negatively diverged RSI and MACD. Next few days won’t be bullish if Monday closes red – which would be a confirmation candle of the short term reversal.
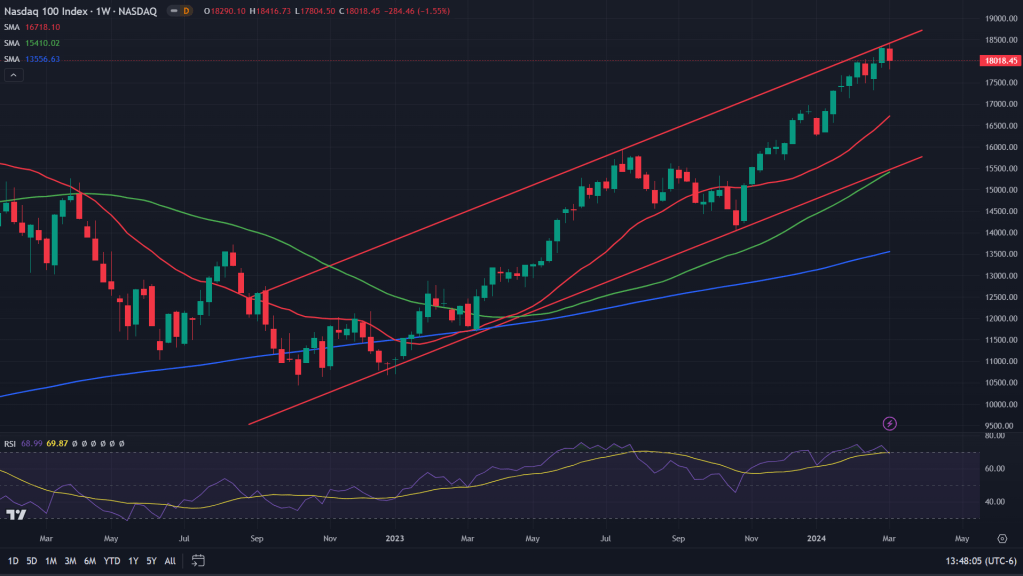
Nasdaq 100 spot index- NDX (weekly candles): Only one red flag for now on the tech index – it sold off from upper end of this channel. Although RSI and MACD too would be negatively diverged if next week also closes red.
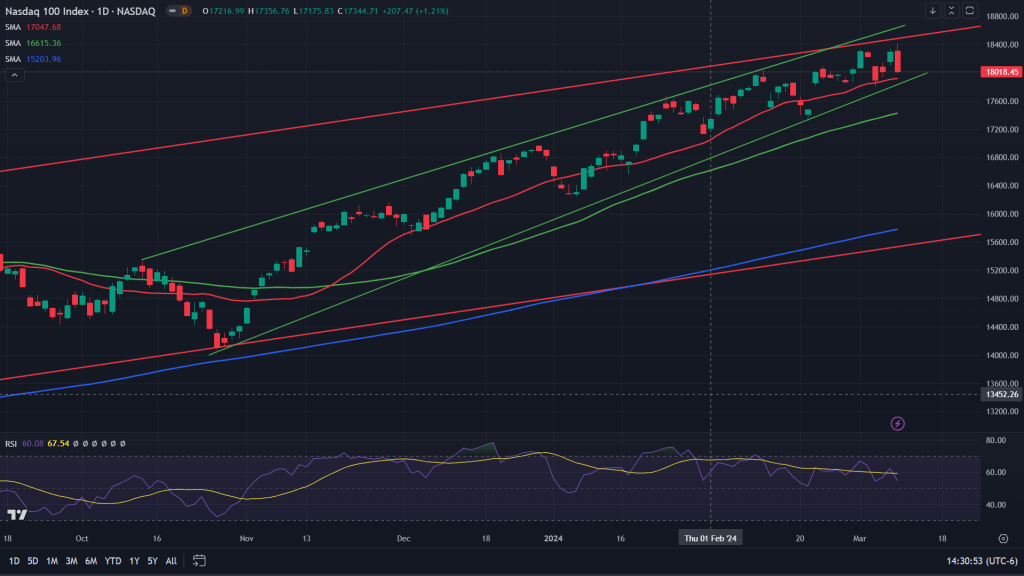
Nasdaq 100 spot index – NDX (Daily candles): But when we zoom in to look at the daily candles, Friday’s candle was as bad on NDX as it was on SPX – bearish engulfing one. Of course we await confirmatory red candle on Monday to call it a reversal yet. Negatively diverged RSI and MACD here too.
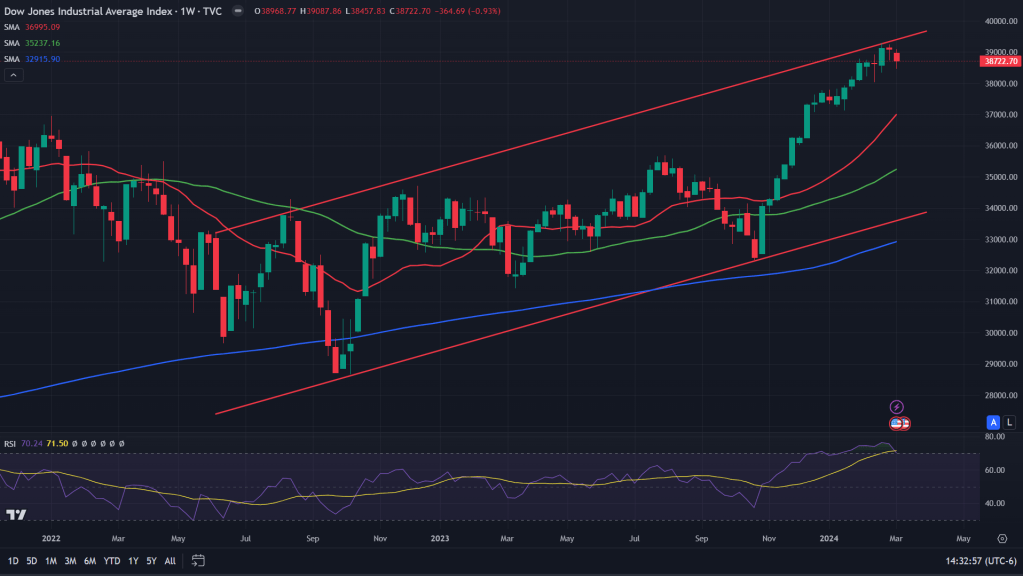
Dow Jones Industrial Average spot index – DJI (weekly candles): While DJI has been lagging in performance for the past 2-3 weeks, it continued to struggle around this upper end of the channel and was the first one to react and get sold off in the past 2 weeks.
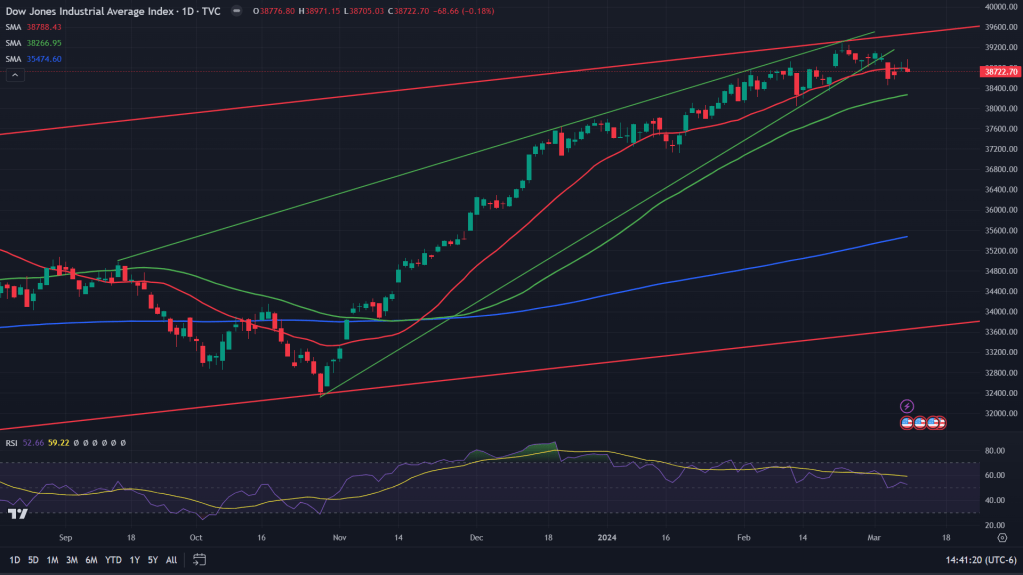
Dow Jones Industrial Average – DJI (daily candles): On daily candles, DJI already broke down off the rising wedge earlier in the week while other key indexes continued to make new highs. Not only that, DJI also struggled to sustain past its 20 days MA – a sign that it wants to go down or may be consolidate at best for the next few days.
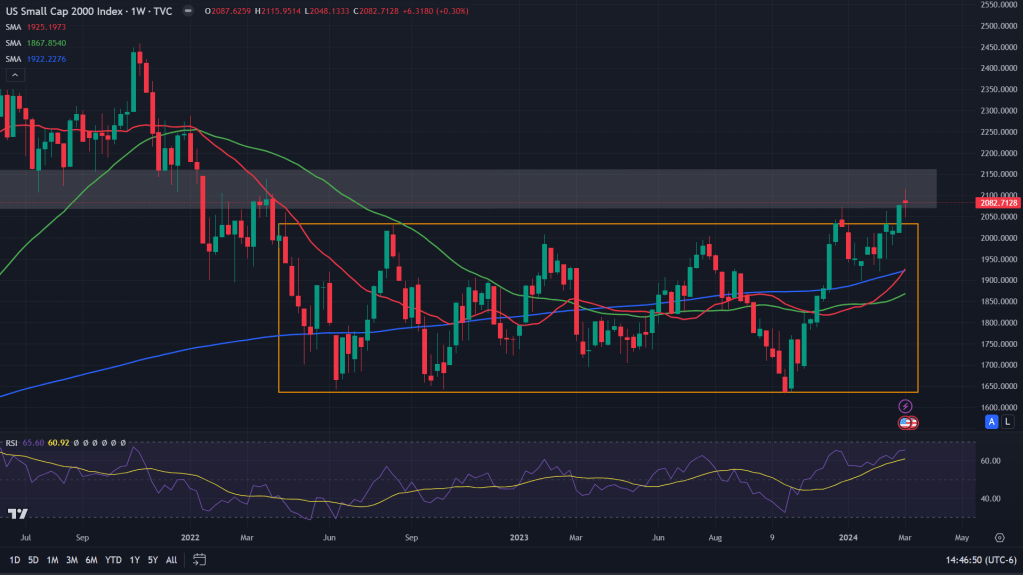
Russell 2000 spot index – RUT (weekly candles): Previous week, RUT index gave us a huge breakout and it felt as if finally small caps are here and we might get a rally that would last longer. But no, last week’s performance did not live up to the expectations and after initial few days’ momentum, the rally petered off. While, the congestion box is still lower, RUT bulls haven’t yet been able to cross past the supply zone overhead, in the range of 2100-2160. Last week’s doji only adds to the indecisiveness of the bulls.
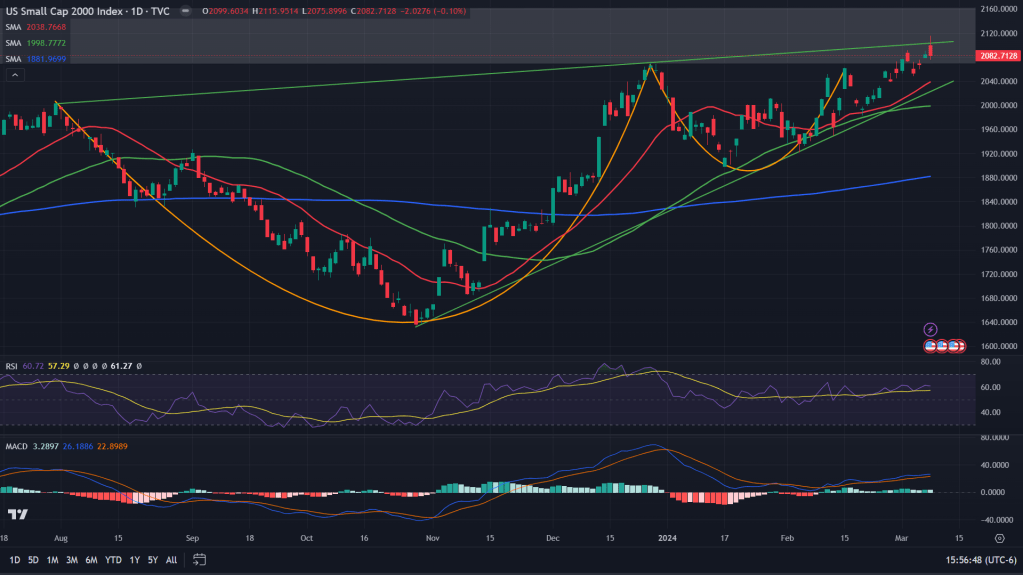
Russell 2000 spot index – RUT (Daily candles): Although when we zoom in a bit to the daily candles, we do get a rejection from upper end of this rising wedge and the cup and handle breakout that seems to be wanting to give up after this rejection.
Conclusion: While there isn’t anything that tells us this bull market is over for good, but the cracks have started appearing on the daily candles. Almost all the major key indexes have either broken down or have rejected from upper end of their respective rising wedges and that’s not a healthy sign to go into next week wherein we get CPI too. Monday’s close would be far more crucial than ever. If major indexes show weakness and close red, then RUT index too won’t be able to hold up and that’s concerning because only now that small caps have started to participate in the rally, only to give up all those gains.

Leave a comment