Where are we and where is it expected to go in the short as well as long term?
It has been a while since we last did a deep dive into the U.S. interest rates to see what lies ahead and it isn’t pretty!
Let’s take a look at the charts first. Then, we try and sync it with the current and future macro-outlook.
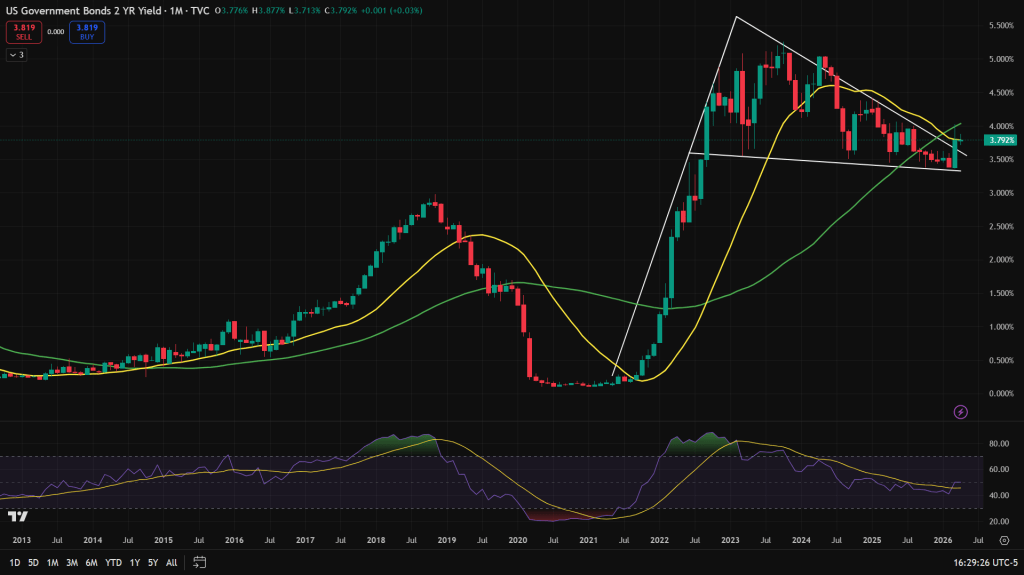
U.S. 2-year Govt Bond yields – Monthly candles: Almost a flag breakout, awaiting a confirmation on the close of the candle above the trendline on the monthly candle charts. Once confirmed, its a sign that short term interest rates are headed up.
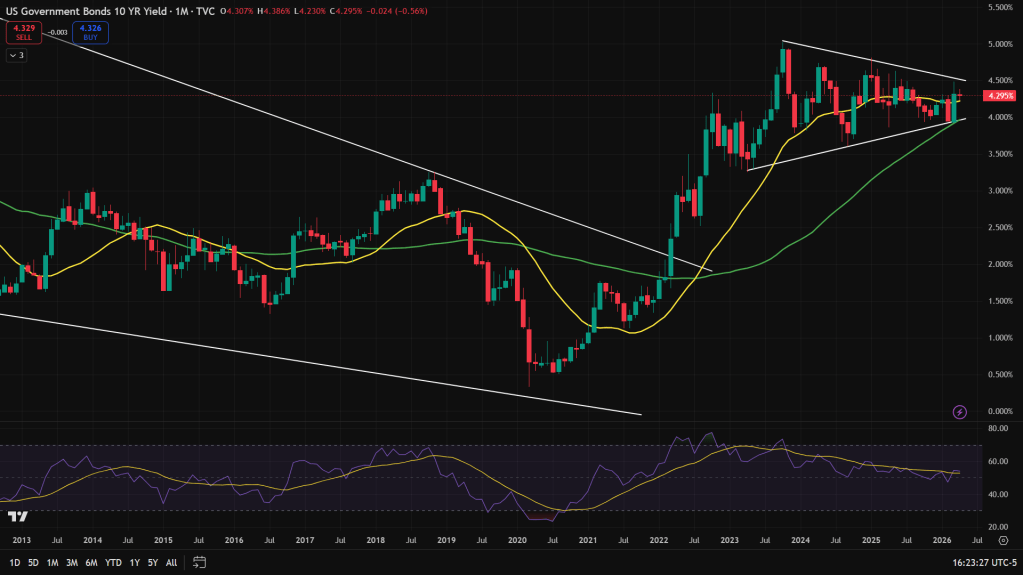
U.S. 10-year Govt Bond Yields – Monthly candles: Consolidating within a higher base triangle formation, which usually would breakout on the upside. We would wait till that happens.
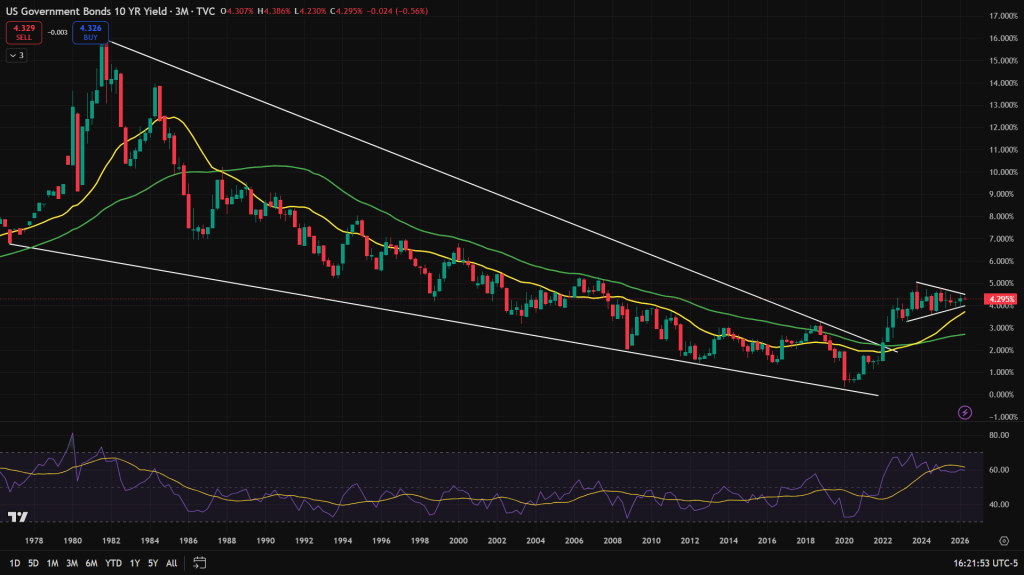
U.S. 10-year Govt Bond Yields – Quarterly candles: But when we zoom out and look at the quarterly charts, 10-year had broken out of a long term falling wedge in 2022 and current consolidation is nothing but a breather of that breakout.
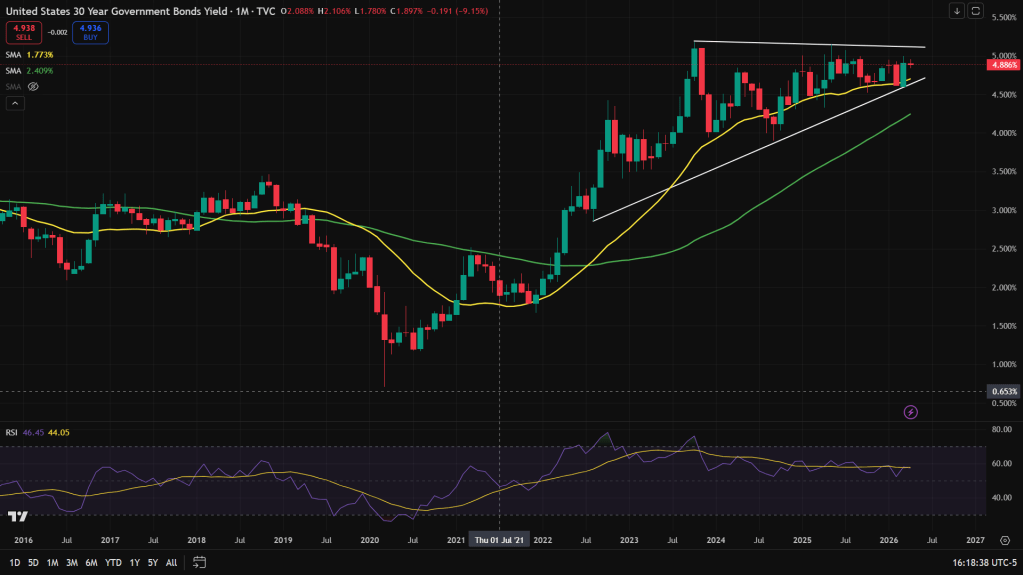
U.S. 30-year Govt Bond Yields – Monthly candles: Even the 30-year candles, which is a barometer of long term interest rates, shows upward trending consolidation and one would be wise to watch this space more closely.
Conclusion: While the charts aren’t conclusive yet, but one should watch this space very closely, especially given what’s happening on the commodities space across the board.

Leave a comment