Lets start with the macro view first: Scenario 1: Imminent crash – As explained in my earlier article (Read here), markets have peaked on their euphoric phase and its time for a long overdue correction to set in, probably a long drawn bear market that would correct many insane valuations. Rising inflation, Fed’s acceptance to have misread inflationary pressures, expecting inflation to stay stickier than earlier and now talking about faster and sooner contraction of the balance sheet – these are all signs of what lies ahead. Not only would this put breaks on an ongoing euphoric rally in stock prices, it would also put pressure on the economic growth.
While economies opening up is a good sign, but the new variants (Omicron, Deltacron et al) are not something to be happy about. Although, my belief is that these are all signs of a pandemic coming to an end as, but the way many countries around the world are going into panic mode, it would only create more pressure on the economic growth front along with creating more supply side bottlenecks that would make inflation even more stickier (as this Bloomberg article explains)
How would Fed and other Central Banks across the world handle this situation? Its a catch-99 situation. While improved job market does give some headroom for the Fed to tame inflation, but the more aggressive it gets, the worse impact it would have on long term economic growth.
Perhaps that is the reason why bond markets reacted by flattening the curve and perhaps inverting too going head, which would mean recessionary signals (as Bond King Gundlach explained earlier this year in this Yahoo Finance article).
Market traders have been fretting the rise in yields as it results in tech stocks taking a hit, but many don’t question why is that so? Simply because the rising yields are signs of slowing growth, which in turn affects stocks. Also the fact that investing in bonds would be more safer at those yields as against investing in tech stocks at such high valuations.
Scenario 2 – Time correction: While low probability, I would still consider this scenario as one of the possibilities over the next 12-24 months. What could happen during this time for markets to just spend time in a broad range while valuations play a catch up?
Inflation: While inflation starts the year on a high note, the base effects of 2021 would start playing on this year’s inflationary expectations and as a result, year on year inflation wouldn’t be as scary as 6-7 percent from June 2022 onwards. During this period, Fed would have hiked at least once to tame inflationary expectations and as a result this double force acts as a positive pressure in taming inflationary expectations.
Growth: Reopening of the economy keeps economy robust and kicked up. Employment scenario remains robust along with Average Hourly Earnings staying elevated.
Stocks: While the initial impact of elevated inflation and rising interest rates would be negative, but the gradually cooling off inflation and pause in interest rates could lead to stocks trying to form a base for a long period of time while valuations do play the catch up by earnings improving and stock prices remaining in a contained zone. This scenario could last for at least 12-24 months to give time for earnings to catch up with elevated valuation broader market.
Micro (Technical) view: While economics does play a key role in the longer term trend of the markets, in the short term and day to basis what matters is the price and emotions of the market participants. Below, I try to decipher the same by taking a look at the longer and shorter time frames.
S&P 500 Futures (ES) – Scenario 1: In a more likely scenario, ES is on the verge of breakdown of a rising wedge. It would be confirmed if in the coming week, ES closes below 4600 on the weekly candle. This also co-incides with 20 weeks SMA just under the trendline at 4574. Breakdown of this wedge would be extremely bearish in the coming months and would be targeting 3500 as per normal wedge calculations.
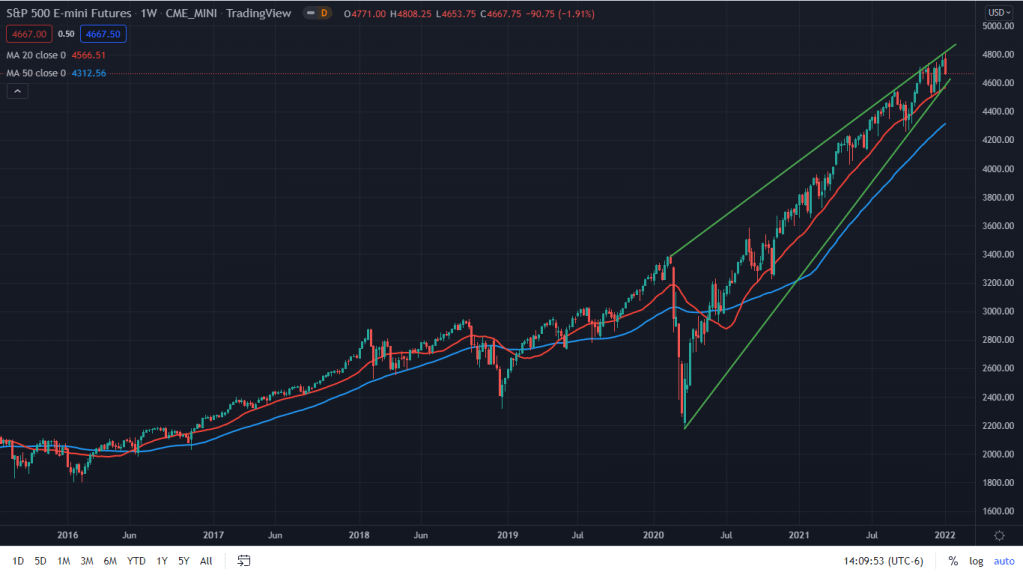
Scenario 2: ES has been holding up the 50SMA on the daily chart for all of last year and through the 2020 melt-up. Previous week, ES closed right at the 50SMA, giving some hope to the bulls to continue to be bullish. But if 50SMA does not sustain this time, then bulls’ last hope would be the recent low of 4520.
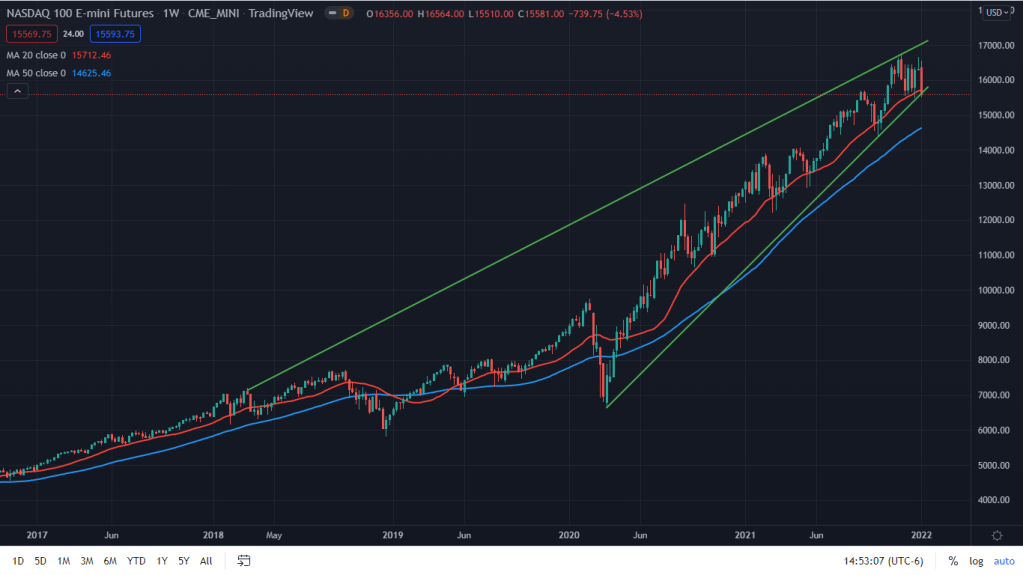
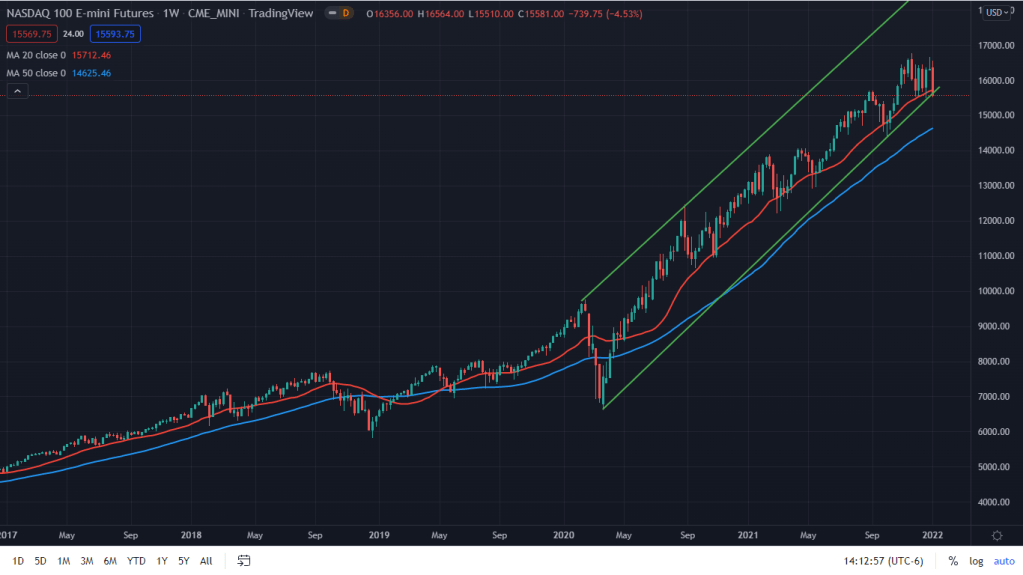
Nasdaq 100 Futures (NQ) – Scenario 1: Another rising wedge breakdown on the weekly candle. The tech index has closed just at the lower end of the wedge and at the weekly 20SMA. Last hope for the bulls to hold on this week or else the target of the wedge on the breakdown would be 12400 as per normal wedge calculation, with many support levels in between that may provide some support to the hopeful bulls.
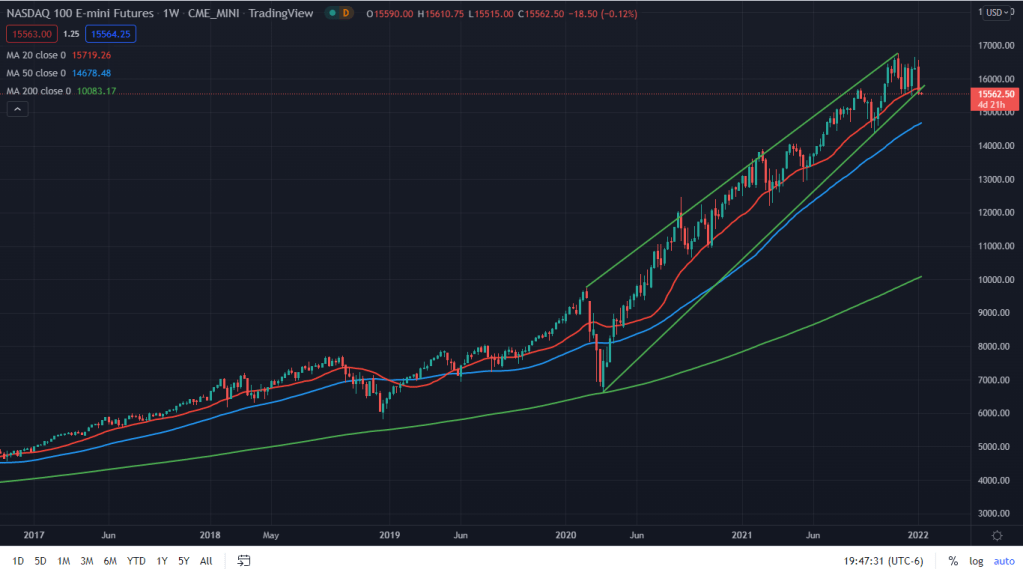
Scenario 2: The only hope for the bulls is this rising channel wherein the prices are exactly at the bottom end of the channel. Is sustained, all time highs should be on the anvil, while breakdown would be targeting recent weekly lows of 14367 as some support.
Down Jones Futures (YM) – Scenario 1: And yes, even this one doesn’t have any pretty picture for the bulls. The only solace? The industrial index future sits at the top end of the wedge as against at the bottom end in the other two index futures. Supports – 35200-35300, i.e. the bottom end of the wedge. Breakdown would be targeting 24000 as per normal wedge count calculation, with many supports for the hopeful bulls.
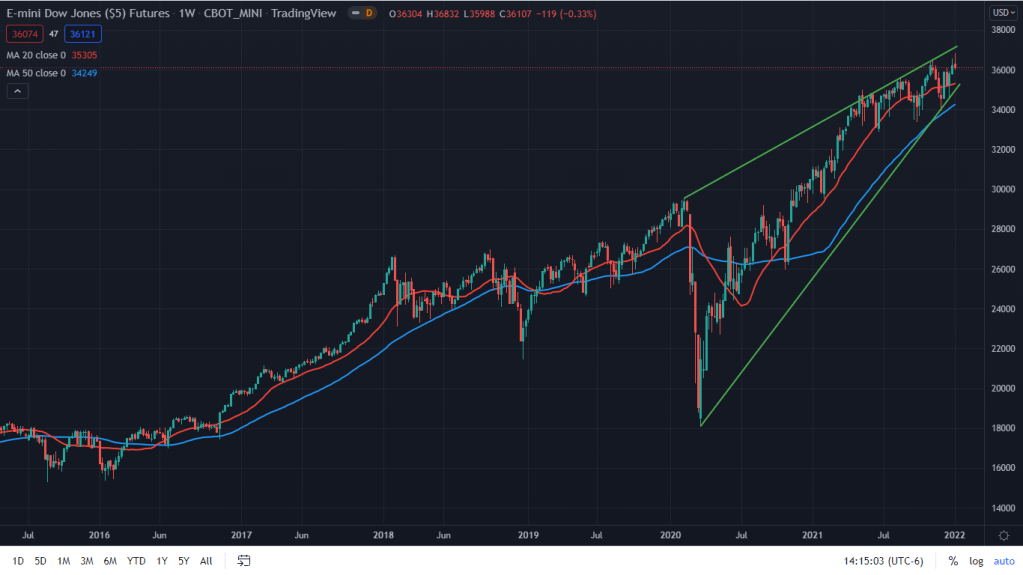
Scenario 2: Even this one isn’t a bullish scenario for the bulls. A multi-year trendline resistance doesn’t bode well for the bulls unless bulls manage all their might to cross past this trendline resistance of the channel.
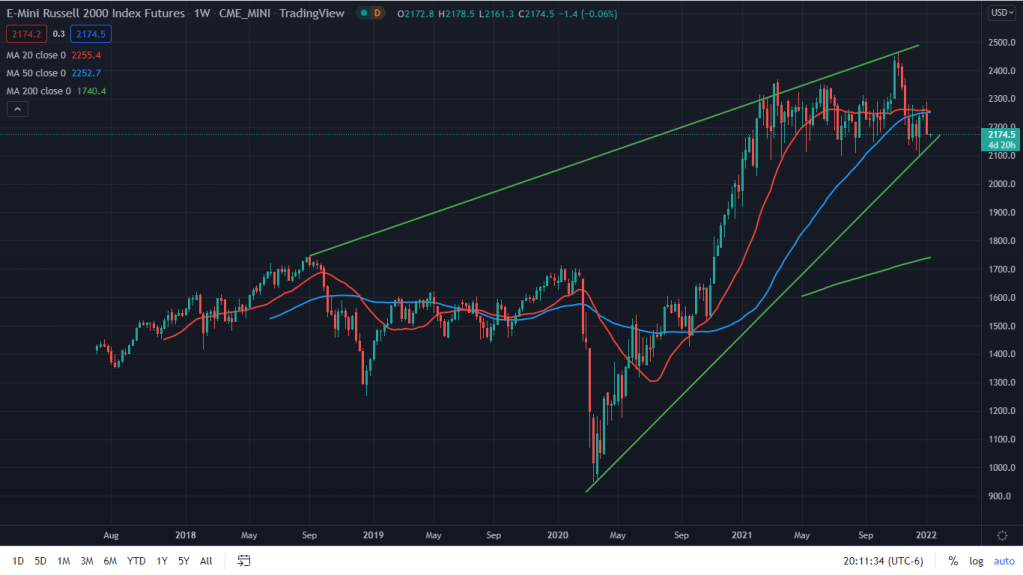
Russell 2000 Index Futures (RTY) – Scenario 1: As posted in the first article, RTY has shown all the features of false breakout and the reversal of uptrend. Last hope? 2100 and the recent low. Unlikely to hold if plays out as per trend following.
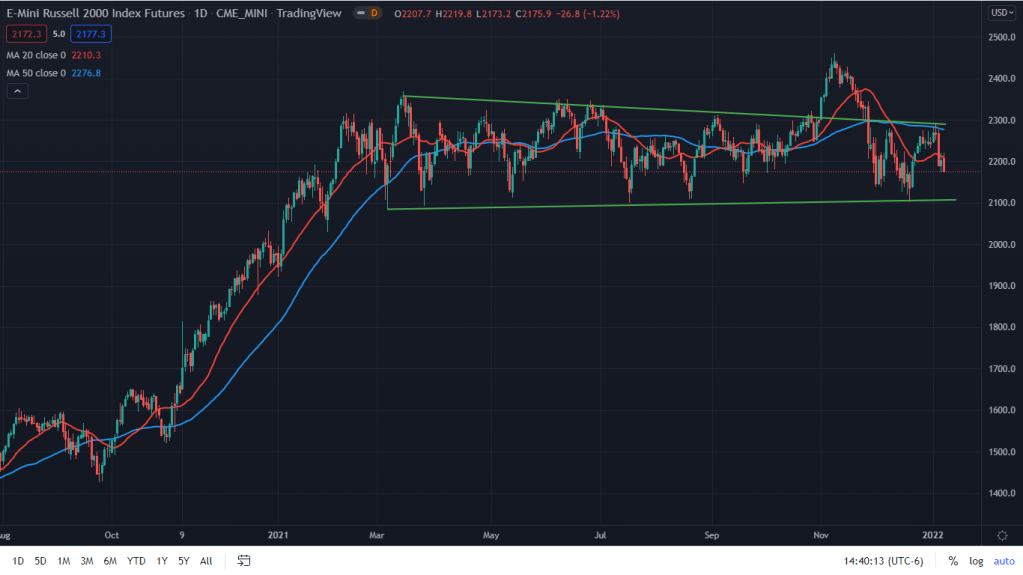
Scenario 2: While the major indexes have formed a rising wedge, how could the small cap index be left behind? Sitting just at the bottom end of the wedge and on the verge of the breakdown.
Conclusion: While the macro backrop may change as it may, the micro (technical) view doesn’t give any pretty picture for the hopeful bulls yet. One can only hope for the trendlines and moving averages to come to the rescue or else the upcoming crash would be very bearish.

Leave a comment