Last week was horrendous for the bulls, to say the least. Bears, however, especially long time readers of this blog, were waiting for such opportunities to pounce back on. If CPI in the previous week threw cake for the bears, FOMC was that icing to enjoy the madness that ensued. We’ll have macro insights sometime this week, but for now lets focus on the technicals and see what are the charts upto:
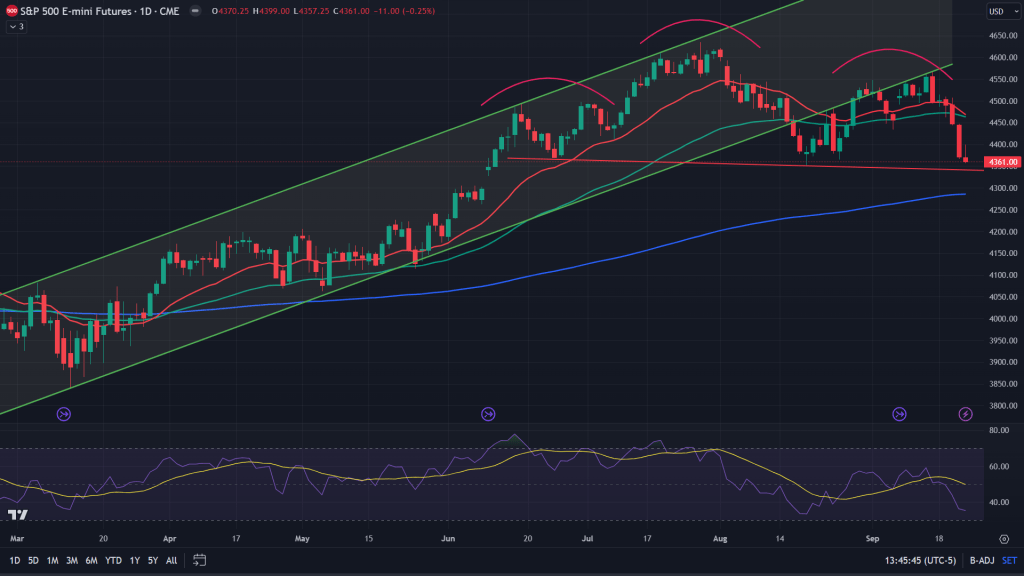
ES (Daily): Daily chart of the S&P 500 futures had already given us the signs of breaking key levels in the previous week. This week it was continuation of the same, in fact even more worse. While there was a channel breakdown that continued, the H&S which was forming all this while, has now reached its neckline stage – Make or break for the bears as well as for the bulls.
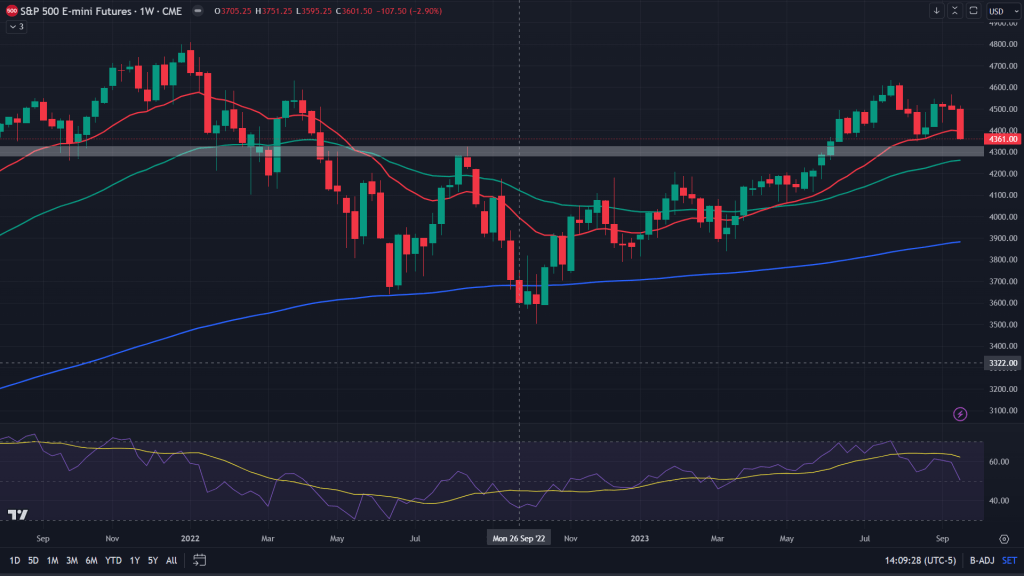
ES (Weekly): Weekly chart suggests, 20 EMA is gone and the ES is now headed towards two key areas – demand zone of 4326-4279 and 50 weekly EMA at 4265. About 100 points more on the downside that is. Ouch!
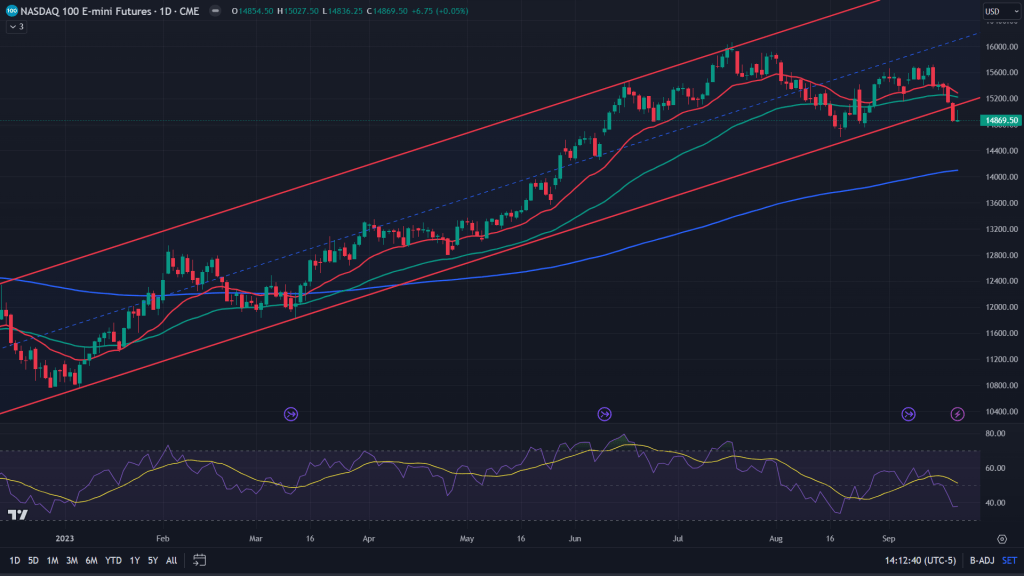
NQ (Daily): Ouch again! While NQ was holding onto the channel even as ES had broken down previous week, this week bears ensured the channel breaks down finally. Yes, that’s bearish and another ouch moment for the bulls!
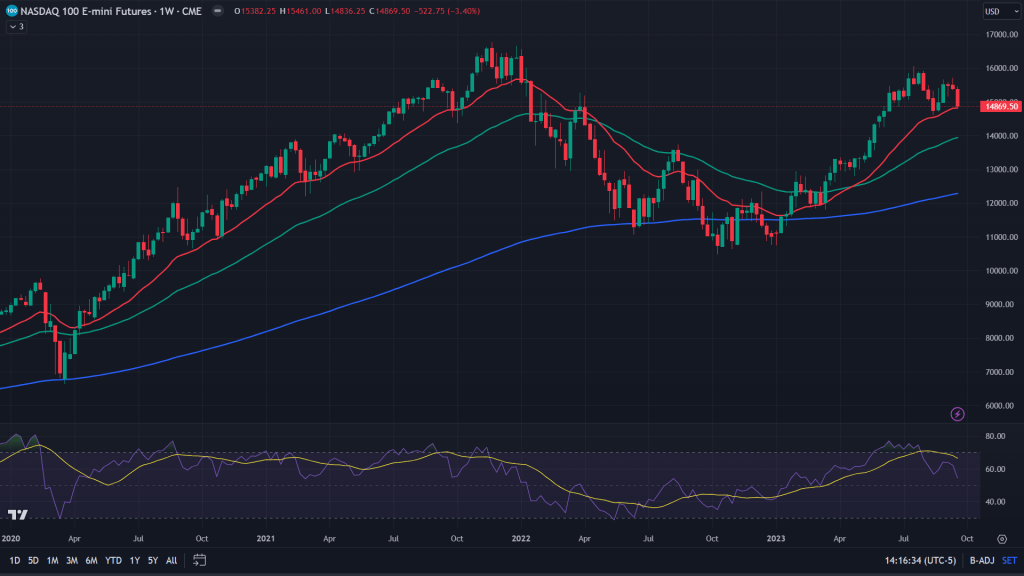
NQ (Weekly): Solace? Barely holding onto the 20 weekly MA, but I won’t hold my breath for it to give us any healthy bounce.
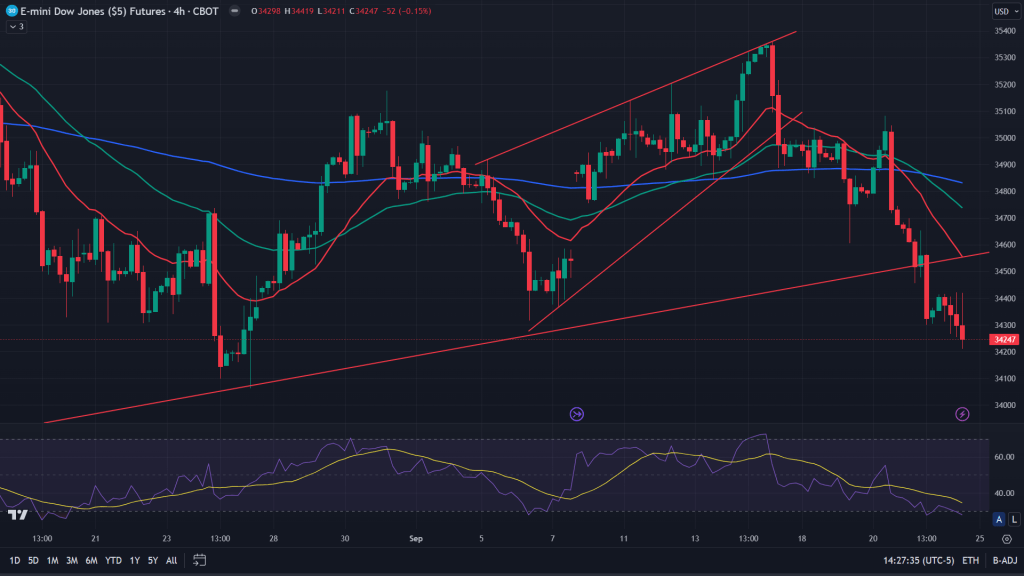
YM (4H): Ouch and ouch! Previous week, the Down Jones futures had broken down of this 4H rising wedge, but it was still holding onto the 200 MA of the 4H charts. Not for long and once bears got control they capitalised on it and the result? Bigger ouch by breaking down off the rising wedge on the daily!
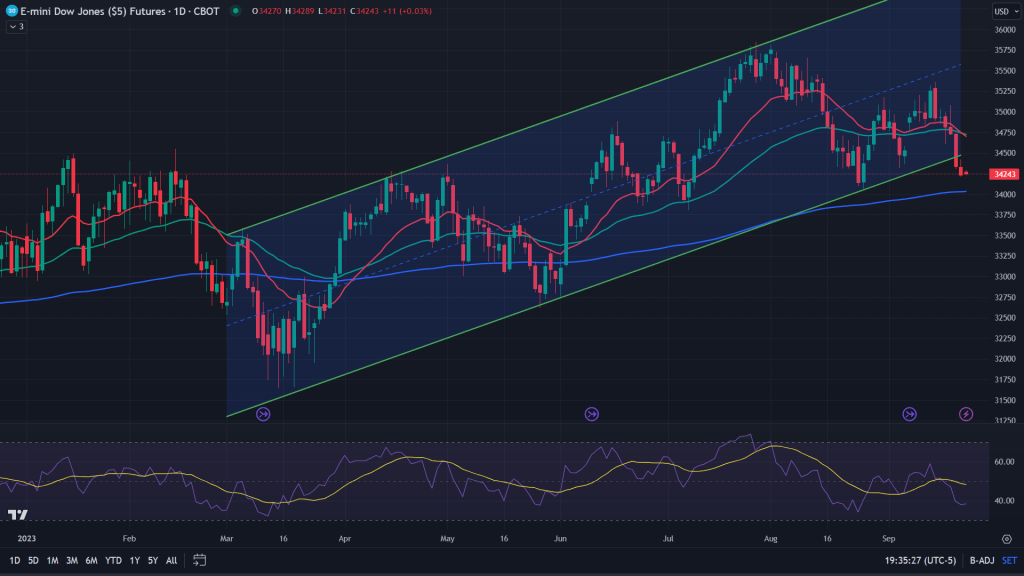
YM (Daily): As shown below. Some hopes in the form of 200 days EMA at 34030 that can provide some help as we can expect backtesting of the wedge breakdown too.
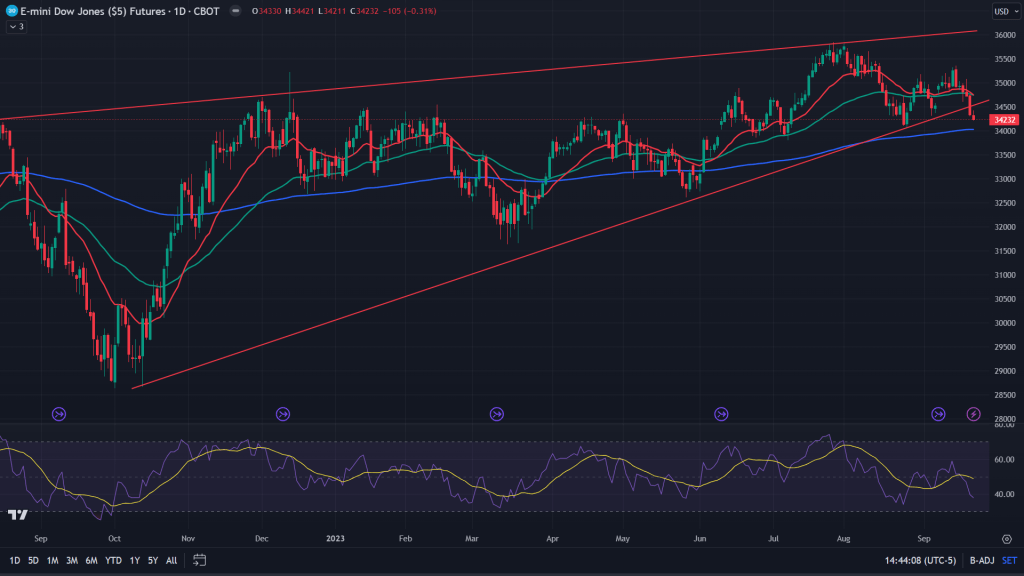
Alternatively.. There was a channel forming too, other than the wedge shown above. This channel has broken down too! Did someone say ouch again?
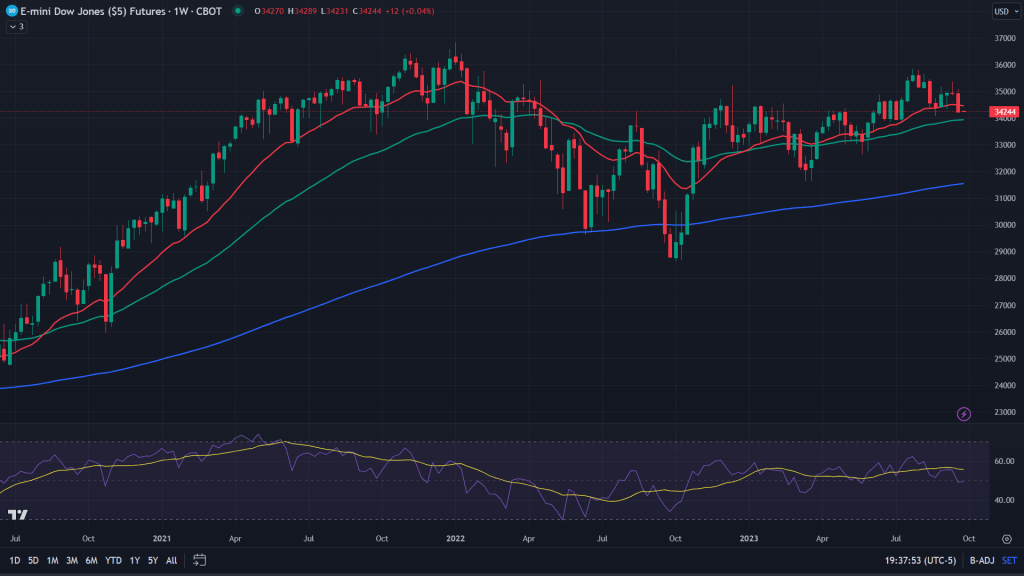
YM (Weekly): While 200 weeks EMA is gone, 50 weeks EMA is next, at 33933, about 300+ points from current price.
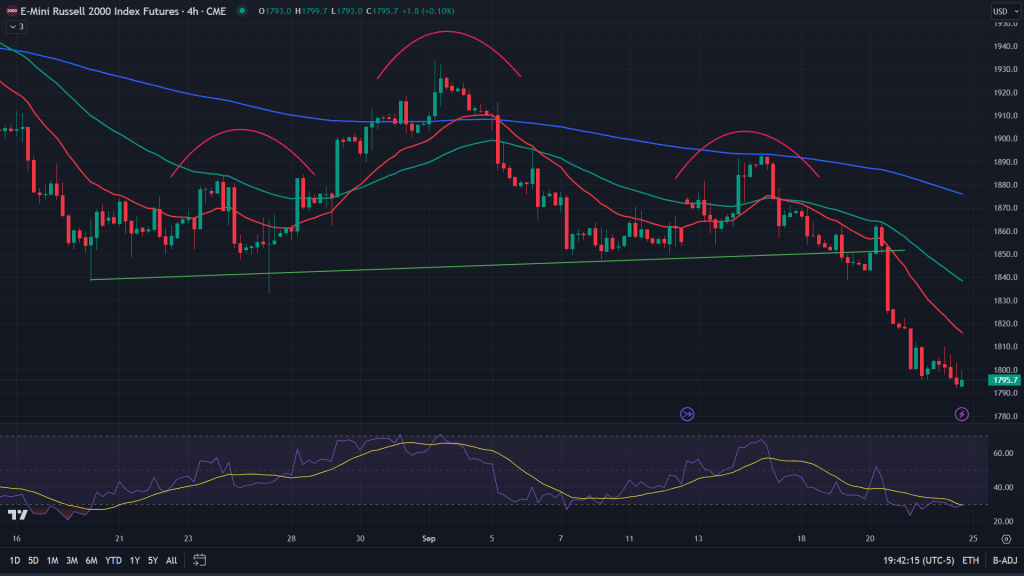
RTY (4H): Small bears within a larger bear! I mean there was a bearish H&S forming on the 4H charts within a larger H&S on the daily. Last week we spoke about it when it had still not broken down. This week to start with, it started with the breakdown and then came FOMC!
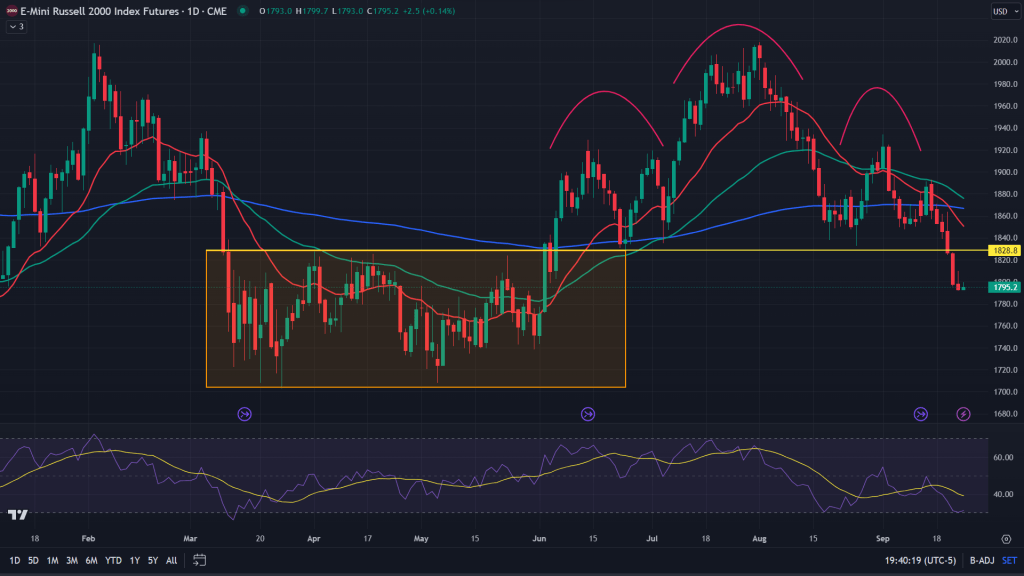
RTY (Daily): FOMC gave enough firepower to the already fiercy bears who were powerful enough due to the H&S breakdown of the 4H charts. Resulting into H&S breakdown on the daily charts too. If that wasn’t enough, this breakdown brings it back below that key support which had long been holding bulls within a boxed range. Yes, I can hear that ouch from the bulls again!
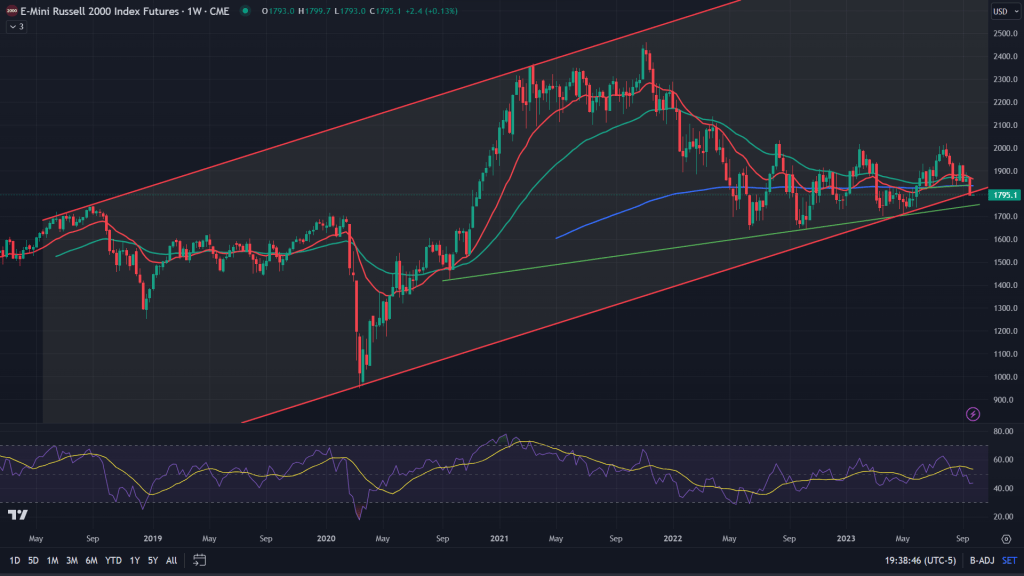
RTY (Weekly): Yet another breakdown. Key channel breakdown. Not only is it ouch. Its that biggest ouch! The only solace and hope for the bulls is if it can hold on to that green trendline support that has been a key support too. But I am not hopeful.
Conclusion: If previous week still had some hopes for the bulls, this week had none. All rallies would only be sold into. Yes there would be some bounces, especially from those oversold levels, but those bounces would only give more firepower to the bears to come back with full force. I would wait for those backtests before entering my new shorts.

Leave a reply to Anil Cancel reply