This bull market has to be one of the most hated bull market of our times. The more it rallied, the more people doubted and tried calling it a top. Even I was a culprit once to have fallen to the temptation to call it a top (Nvidia) and then failed miserably. While I learned my lesson back then and moved on, we still see this hate-love relationship continuing as the market marches on. We keep wondering if THIS is the top, while market continues to rally and investors/traders miss few more points to capitalise on this ongoing bull market.
While, I’m still not calling any top or entering into any prediction game. But it does look like some intermediate top might form in the next few days/weeks. I would post those rationales as part of the conclusion at the bottom of the regular analysis of indexes.
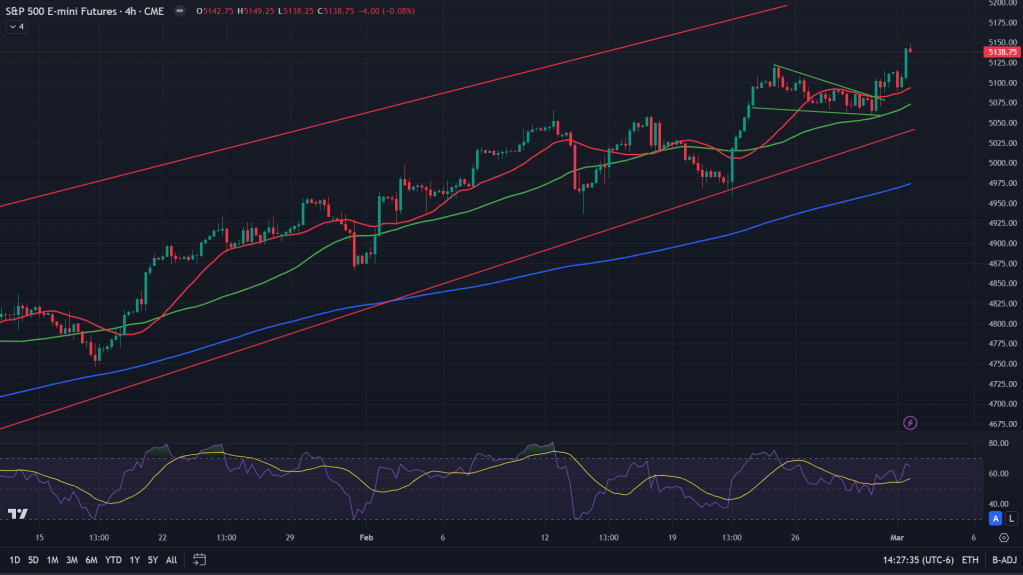
S&P 500 futures (4H candles): S&P was consolidating inside that bull flag for major part of the first week, only to break out of it on Thursday. While that breakout has been sustained and backtested, the rally continues to live on. Expect Friday’s high to be tested again early on in the coming week, before it enters into another leg of consolidation/basing.
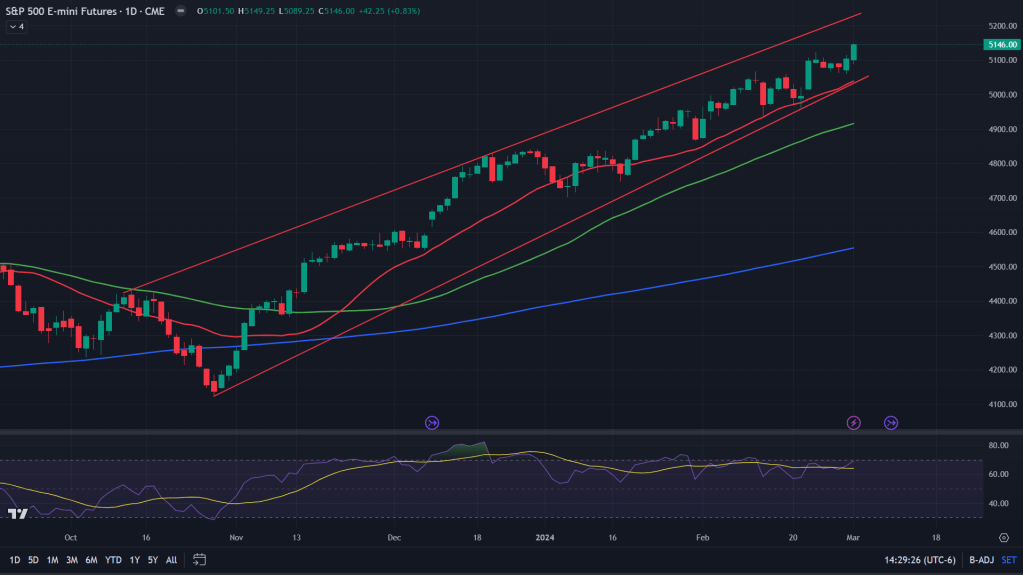
S&P 500 futures (Daily candles): On the daily candles, S&P continues to rally within this rising wedge. Although it did give some jitters last to last week, but only to bounce back sharply from lower end of the wedge.
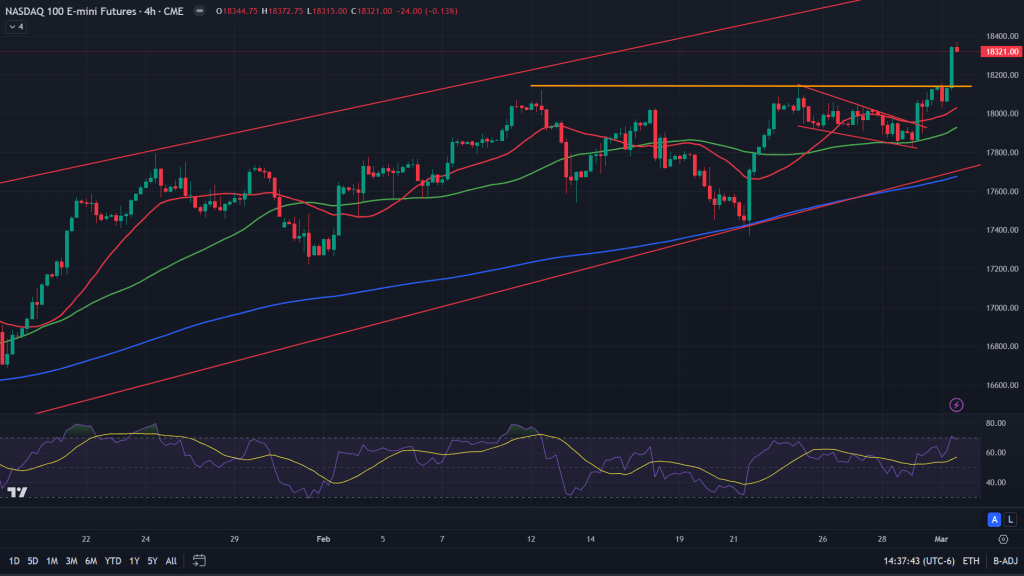
Nasdaq 100 futures (4H candles): I have been posting about this horizontal resistance and that base building all through last week (read here). We broke out of that base early last week and it was only about time even the resistance would be cleared, which we did on Friday. Let’s see where from here, based on daily and weekly time frames.
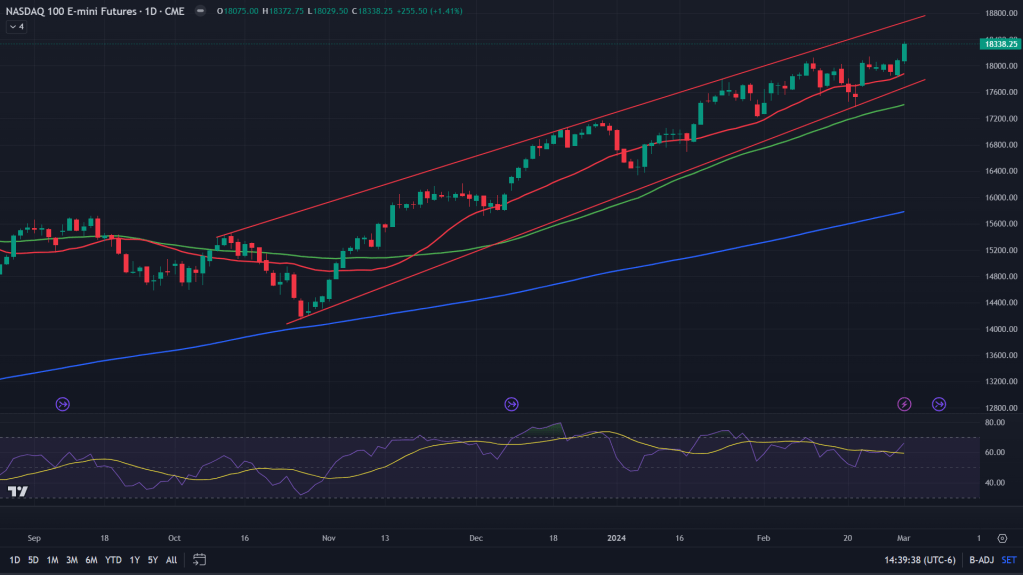
Nasdaq 100 futures (Daily candles): When we zoom out a bit into daily candles, it continues to rise within this rising wedge, taking support from the 20 MA and the lower end of the wedge.
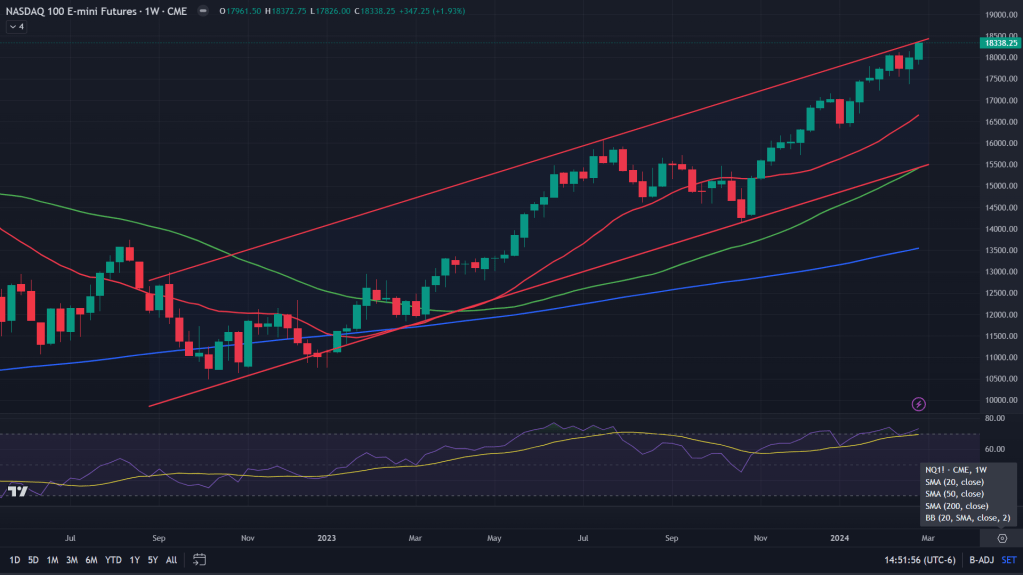
Nasdaq 100 futures (weekly candles): Weekly candles have a caution for the bulls – Price is right under the upper end of this channel. Expect some consolidation, sell-offs from here for the next week before bulls can gather enough steam to tackle this resistance.
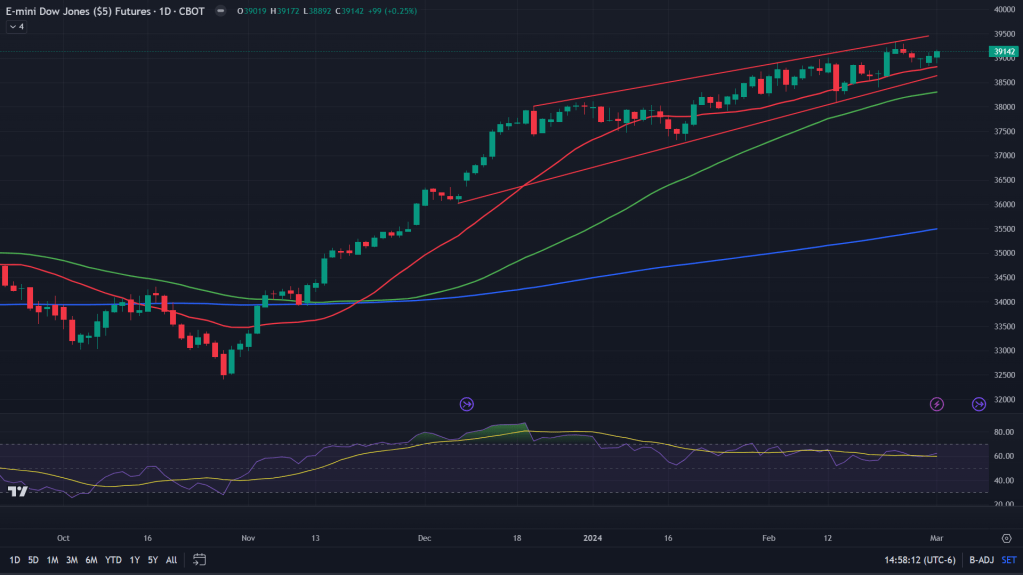
Dow Jones Industrial Average (Daily candles): Just like S&P and Nasdaq, Dow Jones too continues to rise within a rising wedge along with negatively diverged RSI (just like all the other key indexes).
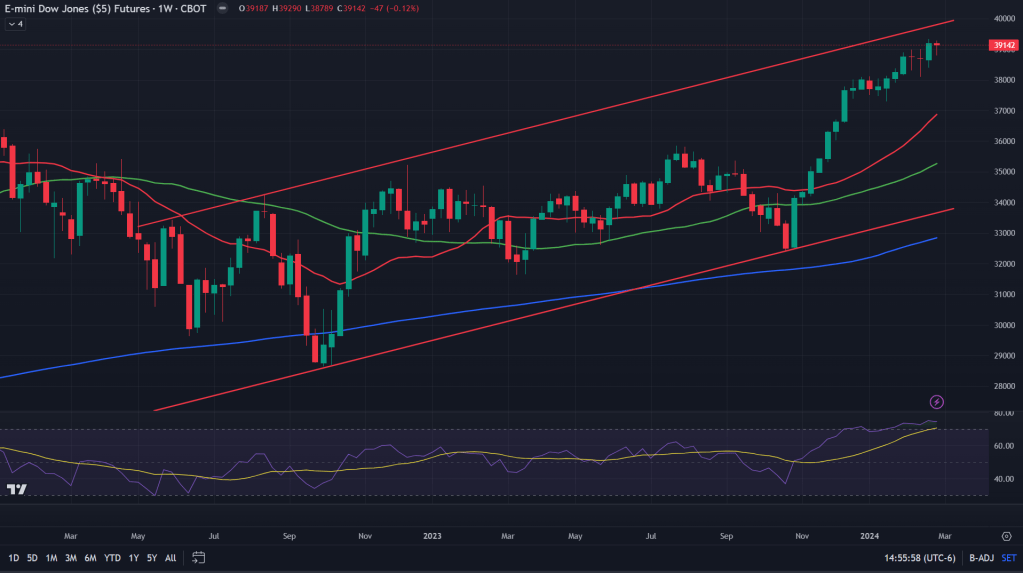
Dow Jones Industrial Average (weekly candles): Zoom out a bit and we see prices rising within this channel, although still early for markets to worry about the resistance yet. May be a bit more before it reacts from the upper channel resistance.
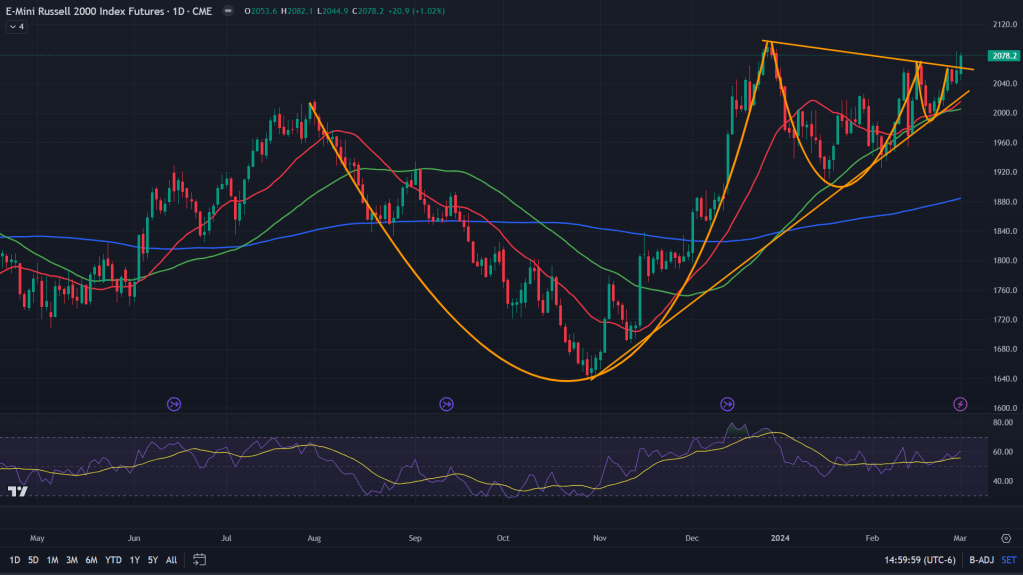
Russell 2000 Index futures (Daily candles): What we witnessed in Russell 2000 Index last week is what I have been talking about on Twitter (read here). It’s a formation that we see in one of the rarest of cases – Base building on another base, C&H formation on another one and finally breaking. Usually such breakouts last for a longer period of time and can surprise us on the upside.
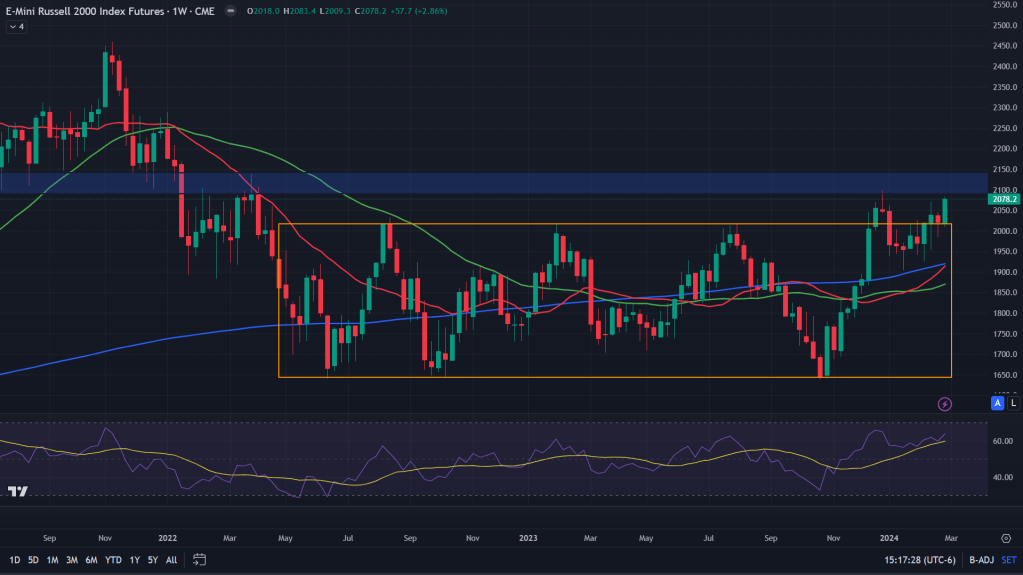
Russell 2000 Index futures (Weekly candles): When we zoom in further into the weekly candles, it has finally been able to breakout of that boxed zone again and looking to cross past the supply zone right above. Don’t be surprised if it pierces right through that supply zone too. Given all that news surrounding SMCI, MSTR and ELF.
Bonus charts: While, I don’t rely on fibonacci retracements as part of my key thesis to make a decision on my trades, today I would be posting few key fibonacci levels that are very important to keep an eye on, especially how the market has been rallying up relentlessly and one wonders if this could be the key level to keep an eye on?
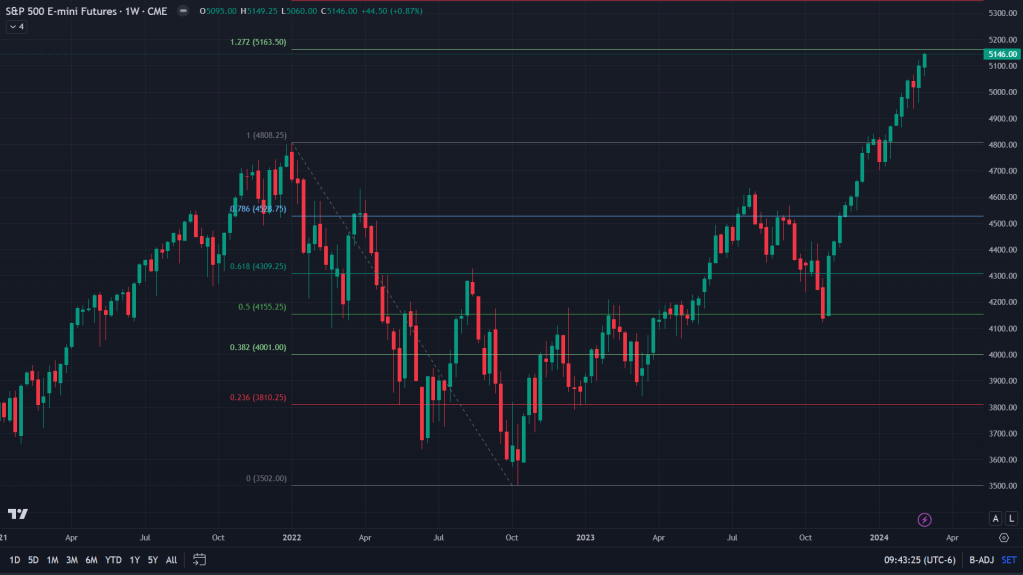
S&P 500 futures (eyeing 1.272 fibo extension):
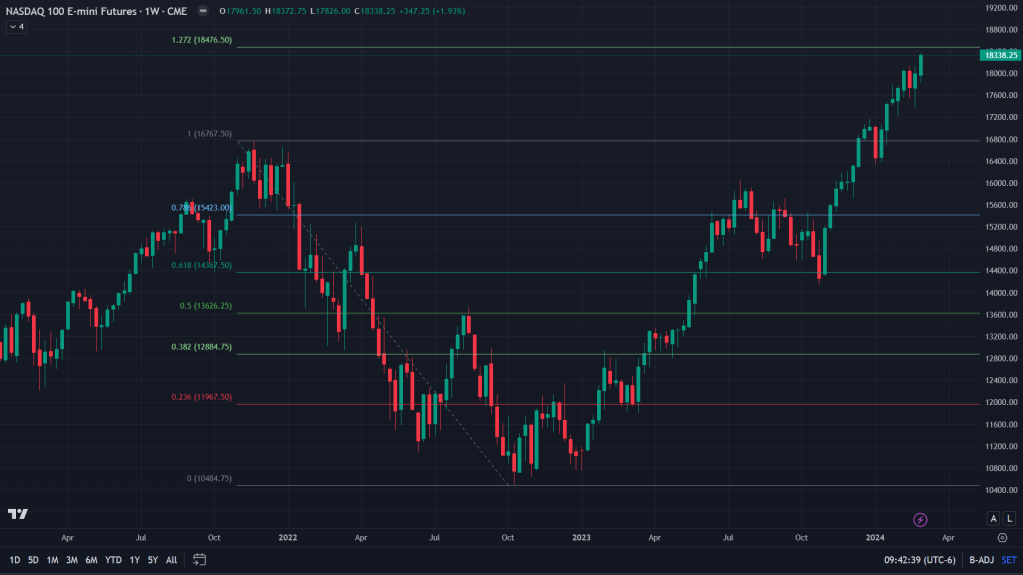
Nasdaq 100 Futures (eyeing 1.272 fibo extension):
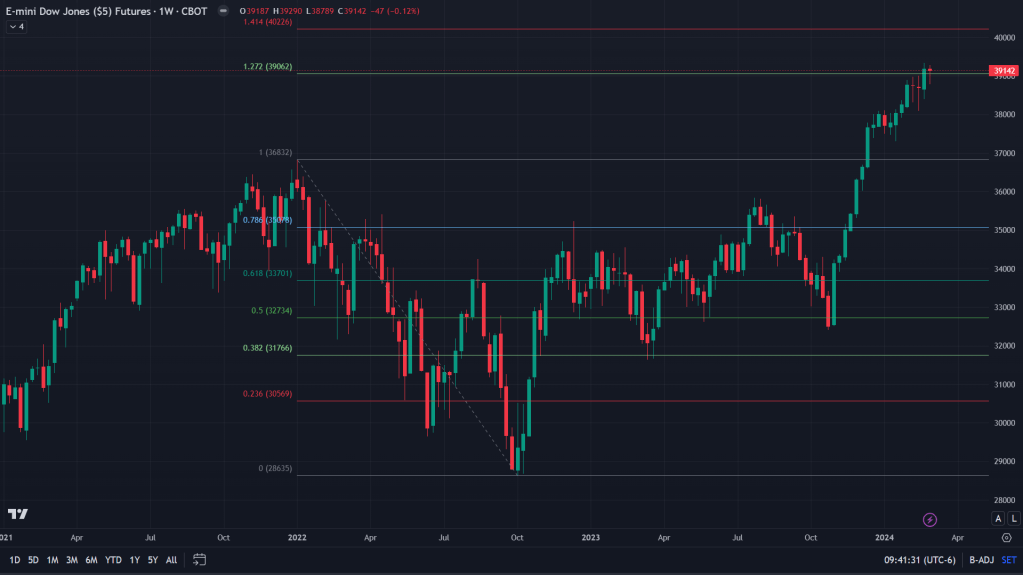
Dow Jones Industrial Average (hanging around 1.272 fibo extension):
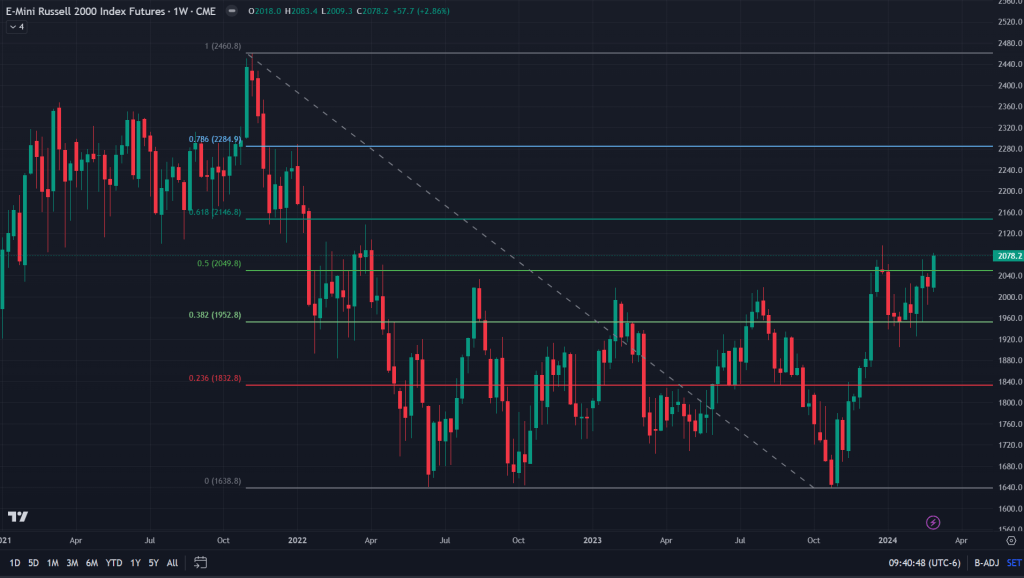
Russell 2000 Index (eyeing for 0.618 Fibo level):
Conclusion: Purely from technical perspective, Russell 2000 small cap index is finally giving all kinds of right moves that would make bulls happy, especially when this was the only missing link in this bull run. SMCI, MSTR and ELF moving into SPX is a news that, although should be negative for Russell 2000, but its still not because the next rebalancing of Russell 2000 index is not due before June. Which means after June 18 (when these stocks would be part of SPX), all these 3 stocks would be NOT just in SPX but also in Russell 2000. Funds would be buying these stocks in a bid to match their benchmarking, this buying would artificially keep Russell 2000 up a bit. How long would that rally last? Well, if you have been tracking these index additions of the past, then you know the answer (clue: March 18). Till then, keep riding the Russell 2000 ride. One key point: If Russell continues to rally along with other indexes on this breakout and the SMCI news, the fizzling out of this rally could be the time when one should be careful of the broader rally. Also, posting

Leave a comment