Previous week when I wrote the article, it was clear that short term looks shaky but intermediate and long term trend hasn’t turned down yet. Guess, what? While nothing changed last week materially, but the prices seems to have got us close to the edge of a cliff. Lets dive in:
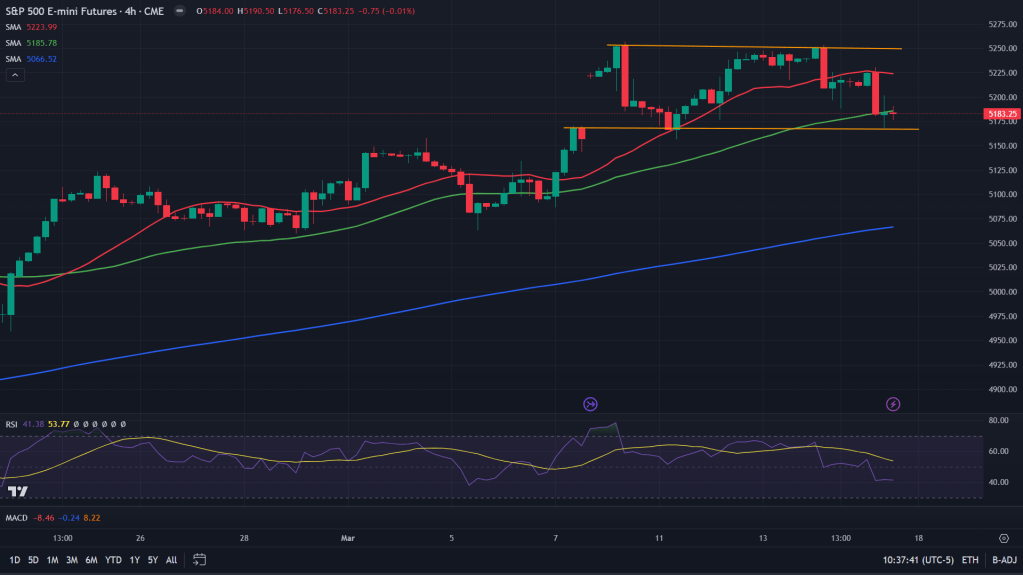
S&P 500 futures – ES (4H candles): While those big red candles look scary and makes one wonder if market is preparing to go further south? But there’s one catch – those two orange lines say its a high base, which is usually bullish. Although I would rather rely on the higher time frames to decide the trade.
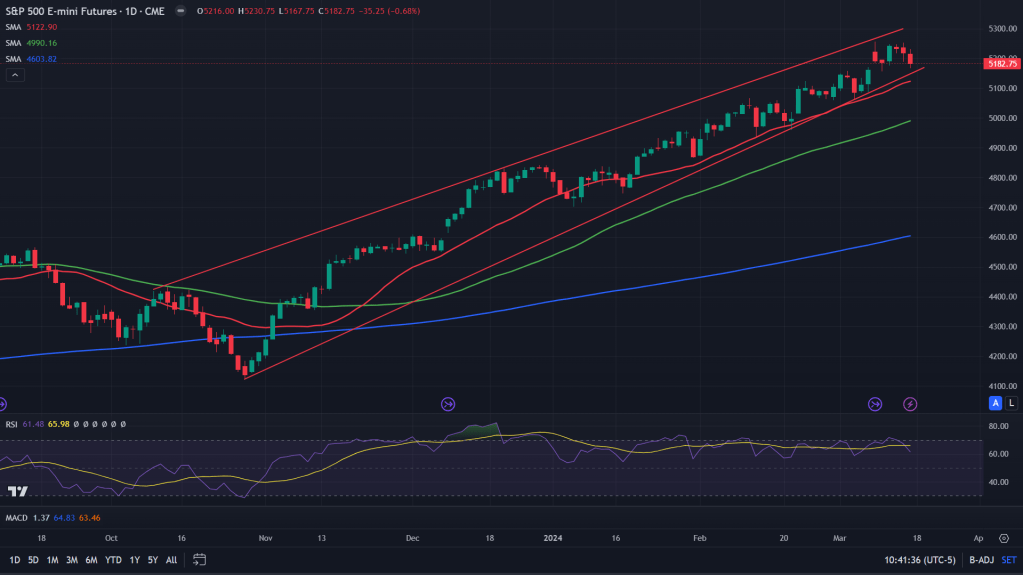
S&P 500 futures (Daily candles): When we zoom out a bit into the daily candles to get more clarity, what we get is an interesting picture – Price of the ES right at the lower end of this rising wedge and not far from 20 days MA. Next week would show us if we are moving lower, especially on Monday when Nvidia related event could make it more volatile.
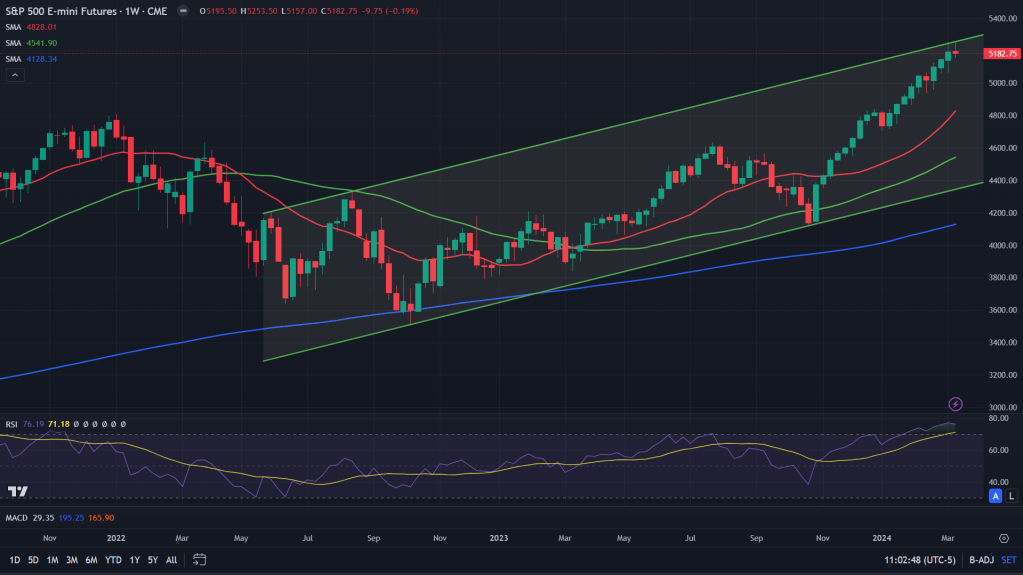
S&P 500 futures (Weekly candles): Weekly candles get all the more interesting though – We are still reacting from upper end of this channel and the candle formation of last week has a bearish tone to it – bearish harami candlestick, which would need a confirmatory next week red candle. As mentioned above, Nvidia event could be a catalyst.
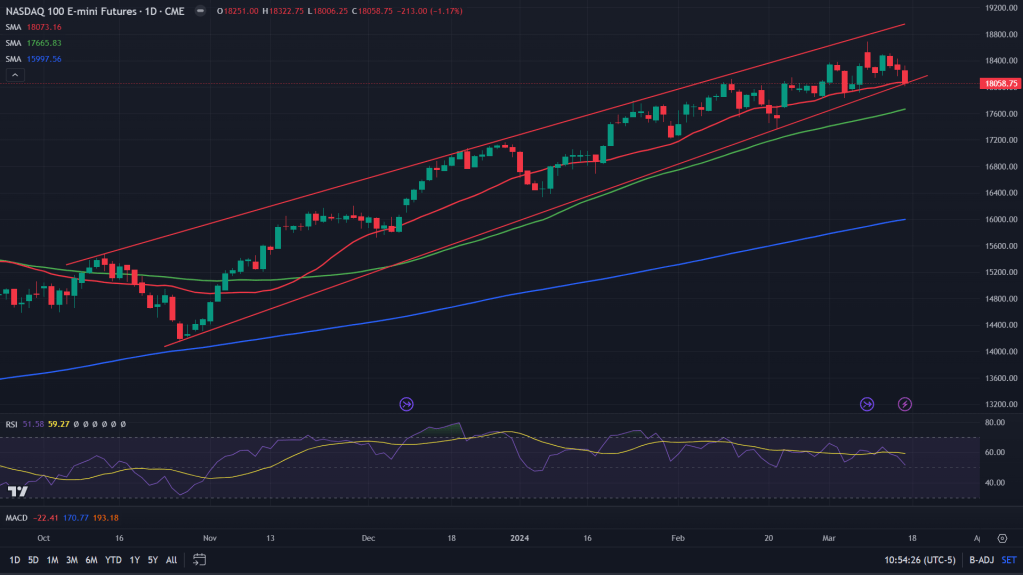
Nasdaq 100 futures – NQ (Daily candles): Daily candles of the NQ are already on the verge of breaking down. Friday it closed right under the 20 days MA and above the lower end of rising wedge. Whoops, we are at the edge of the cliff here!
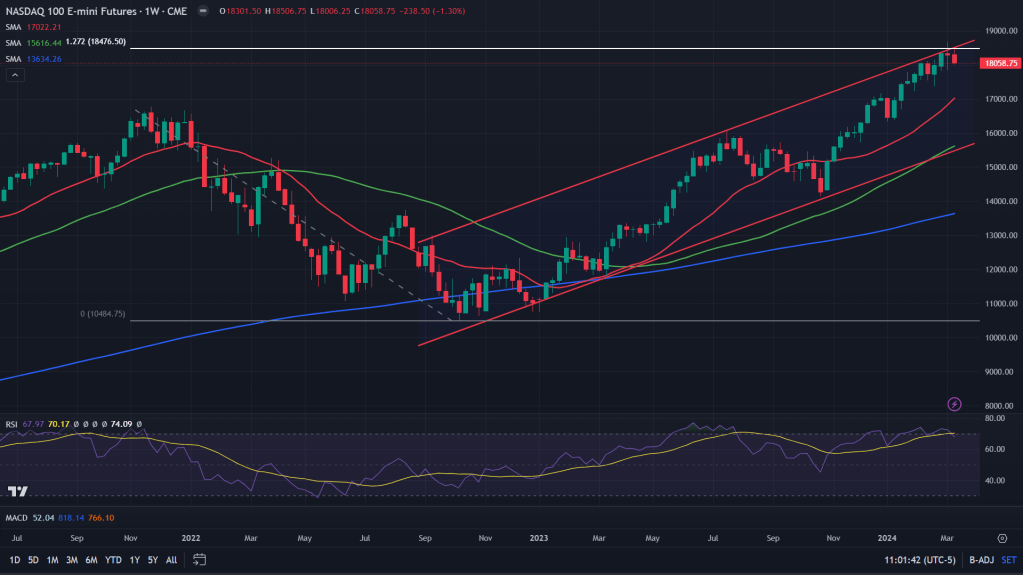
Nasdaq 100 futures (Weekly candles): When we zoom out further and look at the weekly time frame, previous week we reacted from the 1.272 fibonacci level of 2022 fall of the market, last week we continued the bearish momentum, inverted hammer like formation that could take us further down unless Nvidia changes everything on Monday.
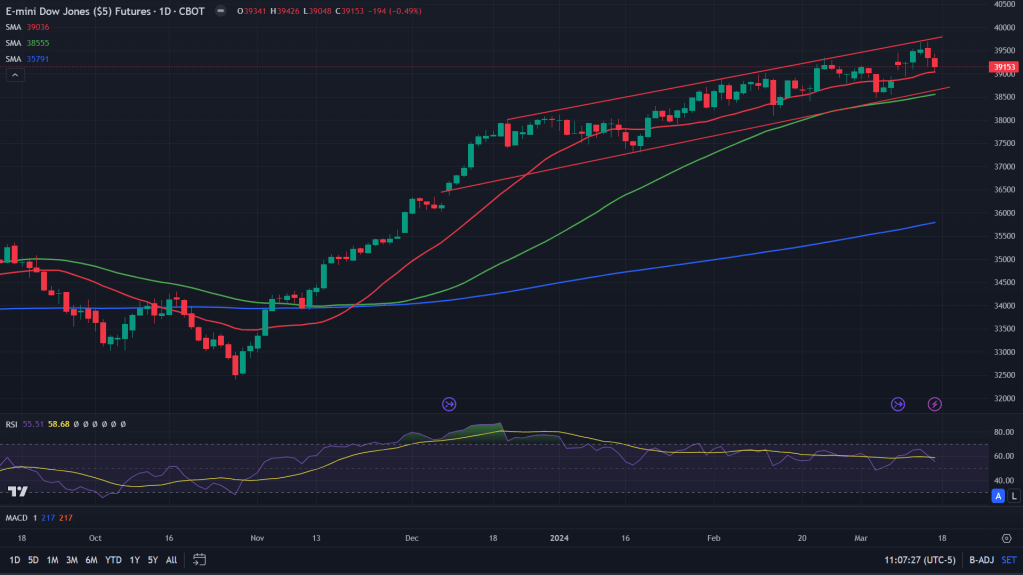
Dow Jones futures – DJI (Daily candles): Daily candles of the DJI lands itself on 20 days MA which could give us some bounce, although one risk – there have been far too many attempts by bears to break off the 20 days MA, making it weaker with each attempt.
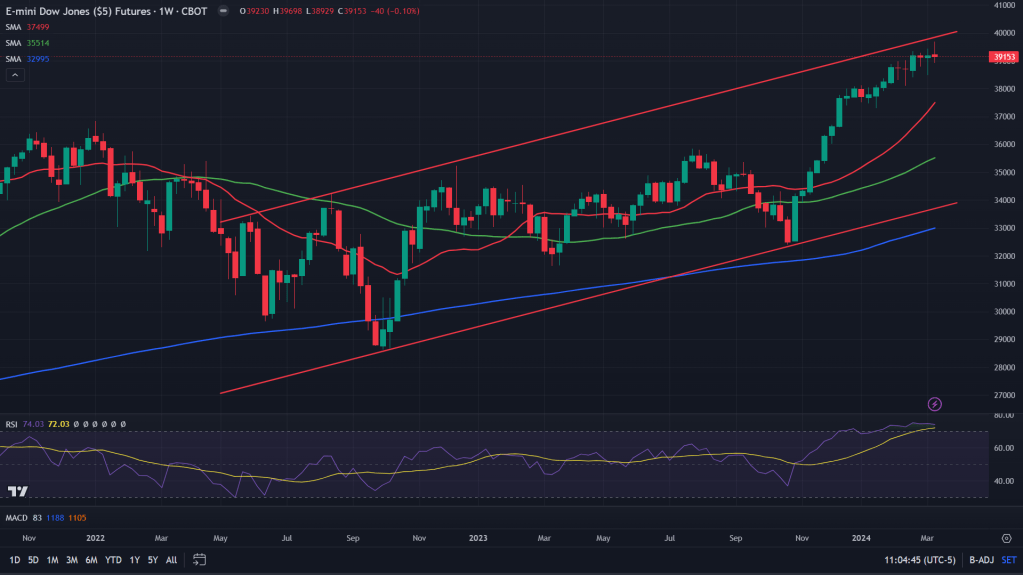
Dow Jones futures (weekly candles): If you look at last few weeks of the DJI’s weekly candles, there have been too many of those “wicked” candles that have been portraying uncertainties and last week’s candle is adding to the bearish tone – evening star at upper end of the channel and thats not bullish.
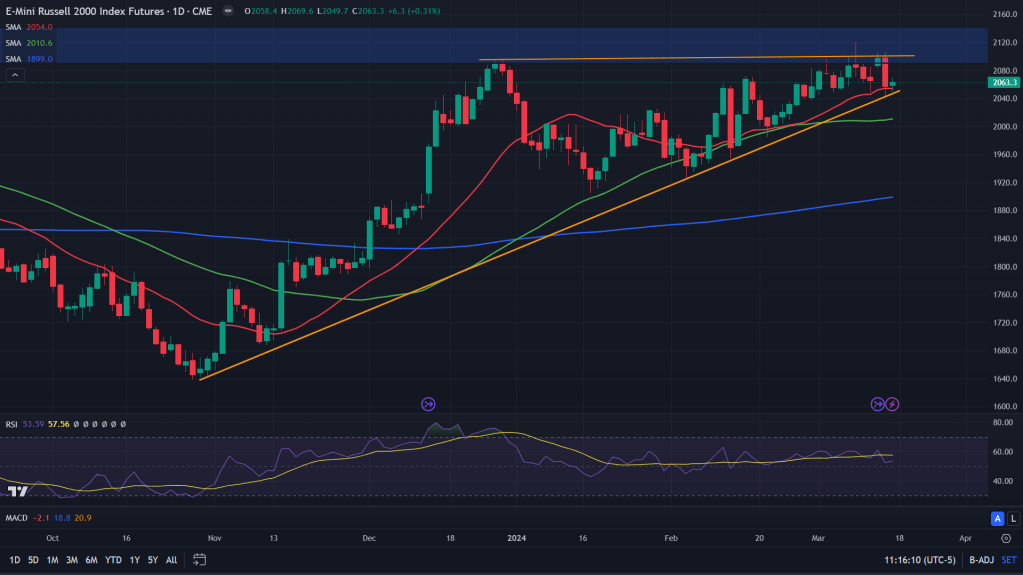
Russell 2000 small cap futures (Daily candles): The only index that still has one last hope left – bullish ascending triangle and the price on Friday closed just above the lower end of the triangle support along with 20 days MA – two key hopes for the bulls in the coming week.
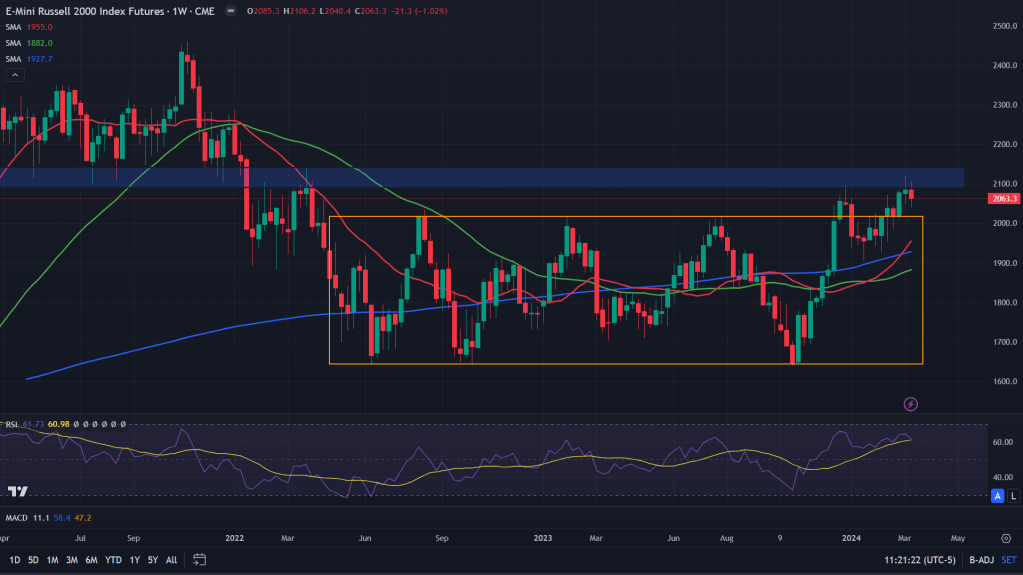
Russell 2000 small cap futures (weekly candles): Weekly candle hasn’t done anything in the last week for the bulls or bears to be excited about. It was a week that’s best to forget about.
Conclusion: Previous week daily candles showed some cracks and last week showed some more. Given that Nvidia has been holding the entire market on its own almost through the major part of this rally, Monday’s event would get all the more critical and the charts showing it all too, barring Russell which is still trying to catch up with the rest of the market while others are trying to reverse the course.

Leave a comment